

November 20, 2025
US LNG Capacity Forecast to 2030
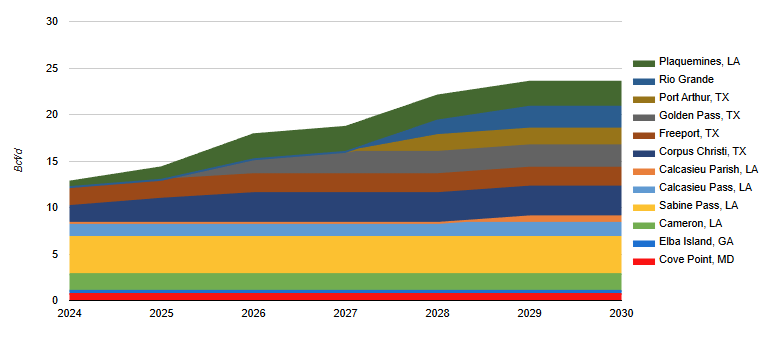
Forecast to 2030 of North American liquified natural gas (LNG) capacity from US facilities. Additional map showing the locations of the facilities.
November 20, 2025
World LNG Liquefaction Capacity Growth by Project
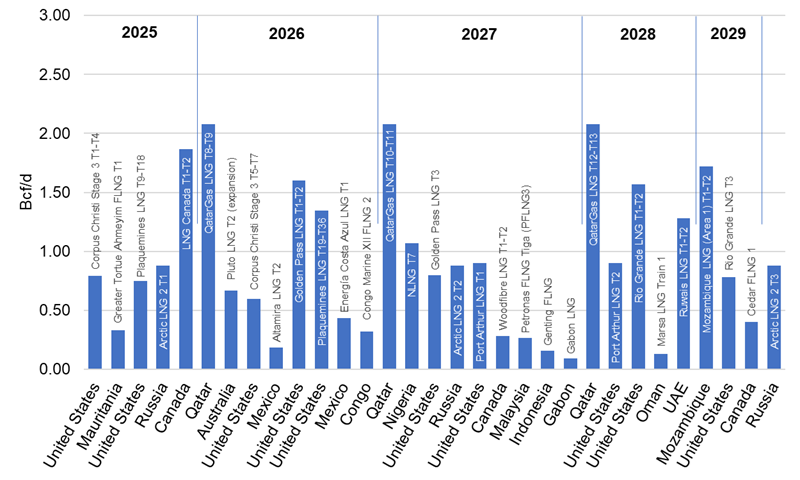
The chart presents upcoming LNG liquefaction projects scheduled between 2025 and 2032, highlighting global efforts to expand supply capacity amid ongoing shifts in energy trade.
November 20, 2025
World LNG Liquefaction Capacity Growth
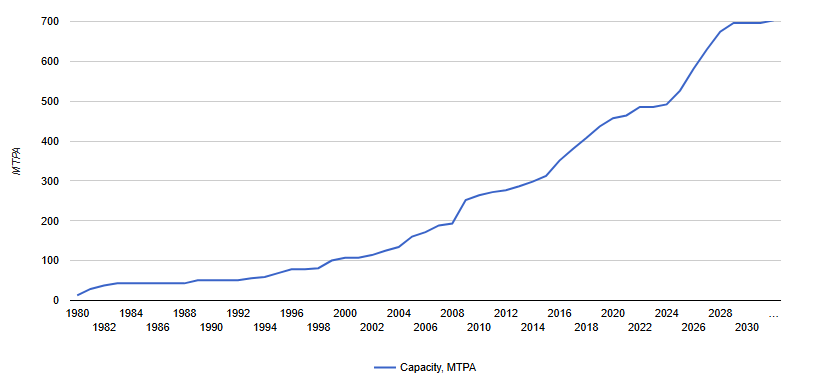
Forecast of world liquefied natural gas (LNG) liquefaction capacity growth through 2032, in MTPA (million tons per annum). Early last year, liquefaction projects totaling 700 MTPA were proposed, primarily in the US and Canada, although most will be uneconomical and not be built.
November 20, 2025
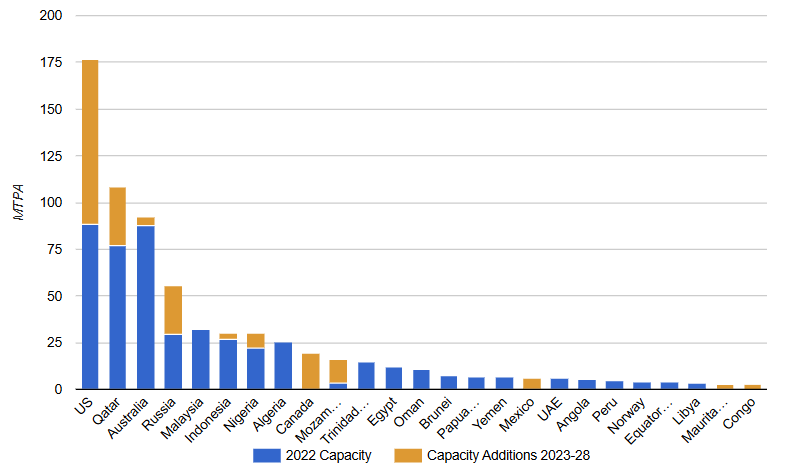
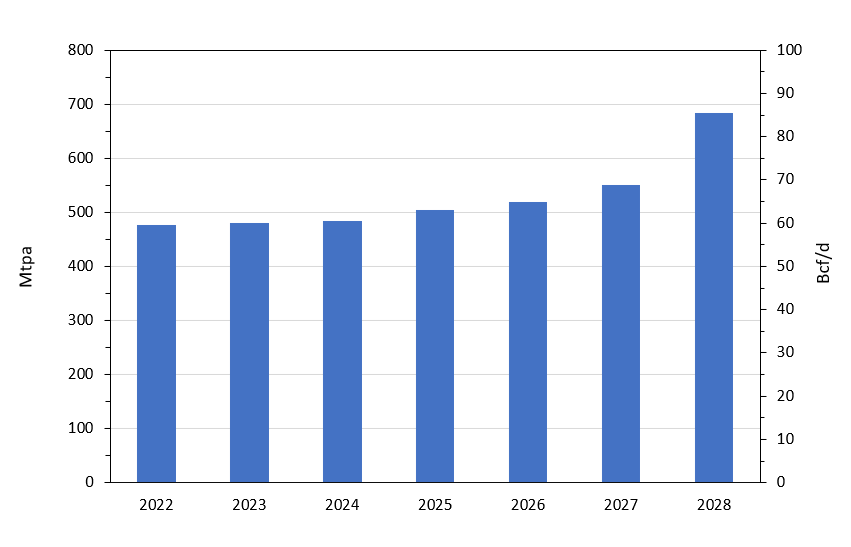
Global Liquefaction Capacity Growth 2024-2032
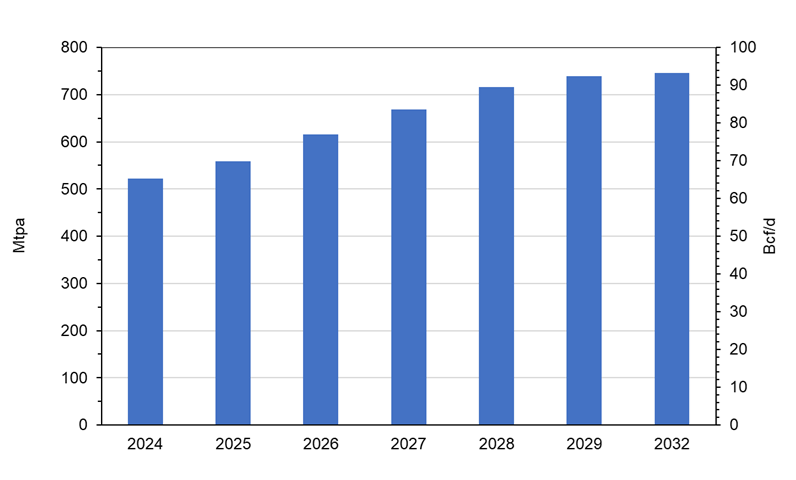
Global LNG liquefaction capacity growth from 2024-2032 in mtpa and Bcf/d equivalent. Additional charts showing 2024 LNG exports by country and 2032 liquefaction capacity by country. In 2024, there were 22 countries exporting LNG led by the US, Australia, Qatar, Russia and Malaysia. Combined, these top exporters accounted for 75% of the world total. The largest exporting region continued to be Asia Pacific with a total of over 139 mtpa (~18.5 Bcf/d) in 2024.
November 20, 2025
North American Industrial Demand for Natural Gas
North American industrial demand forecast for natural gas to 2035, by region. Industrial demand is the most price sensitive of all of the demand sectors. During the 2000’s, price increases caused overall industrial demand to decline. However, with the rapid production growth in low cost shale gas, lost industrial demand began to recover.
November 20, 2025
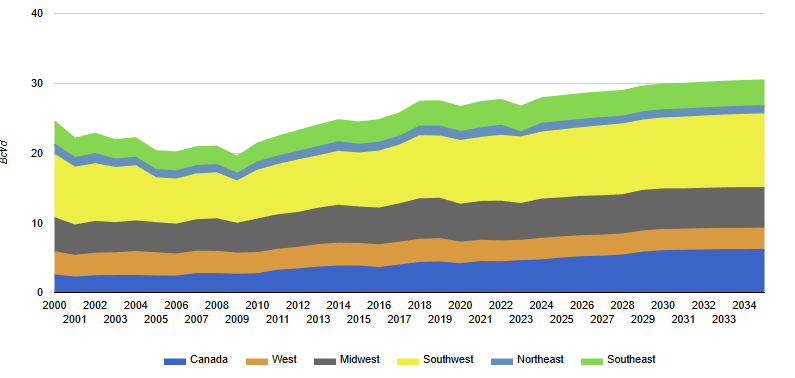
North American Power Demand to 2035 by Region
Regional power demand forecasts for North America to 2035, by fuel type.
November 20, 2025
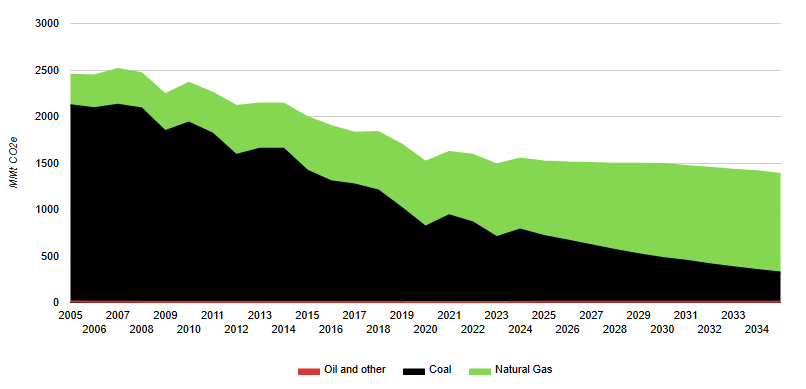
North American Power Emissions to 2035
North American power generator emissions to 2035 by fossil fuel (coal, natural gas, oil/other). By 2035, power carbon emissions will be reduced from 2005 levels in both the US (44% lower) and Canada (36% lower) – both countries benchmark year for Paris Commitments.
November 20, 2025
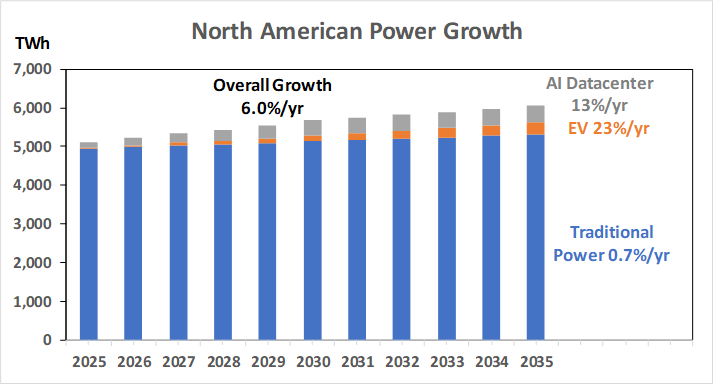
North American Power Generation Growth Sectors
Traditional power demand sectors such as Residential, Commercial and Industrial remain are tied to economic activity and constraints therein. Therefore, modest growth of 0.7%/yr is expected. Electric Vehicles (EV) growth is expected at 23% to 2035.
November 20, 2025
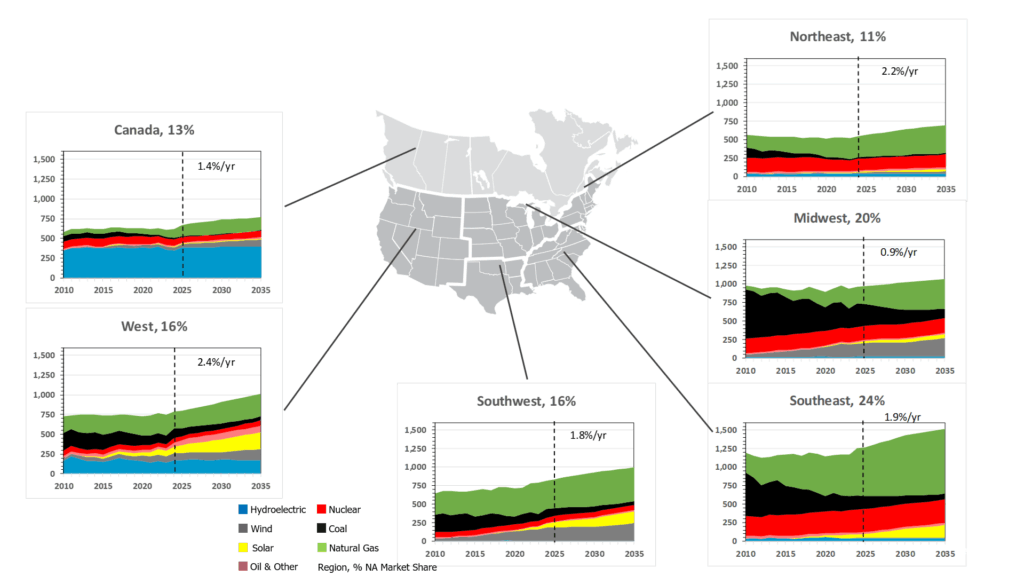
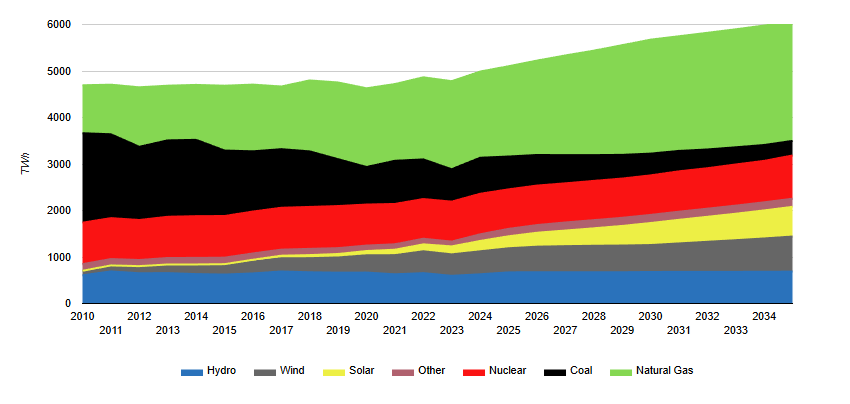
North American Power Generation to 2035
North American power generation to 2035 by fuel type. Coal-fired power generation continues to lose market share through retirements with natural gas and renewables (wind and solar) meeting this lost coal-fired generation and future demand growth.
November 20, 2025
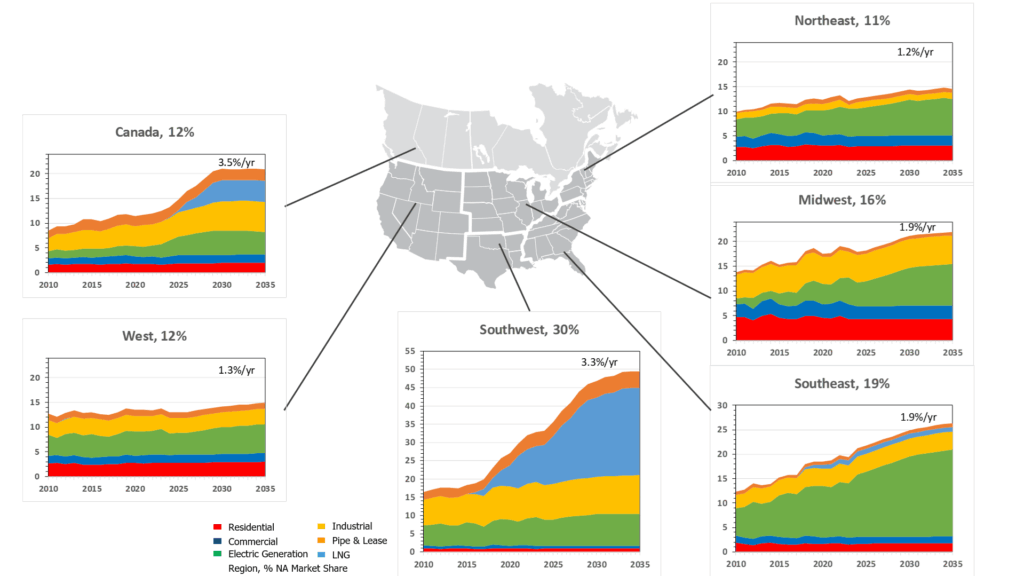
North American Gas Demand by Region
Breakdown of North American gas demand by region and end-use sector to 2035. Regionally, the US Southwest is expected to lead natural gas demand growth due to strong LNG export development. Declining coal-fired capacity drives growth in gas use, especially in the Midwest and Southeast regions.

November 20, 2025
North American Gas Demand to 2035
Forecast to 2035 of natural gas demand in North America by sector, including residential, commercial, power generation, industrial, LNG exports, and fuel. The largest growth drivers for natural gas are liquefied natural gas (LNG) exports and increased use for power generation as the industry retires and closes coal-fired plants.
February 15, 2025
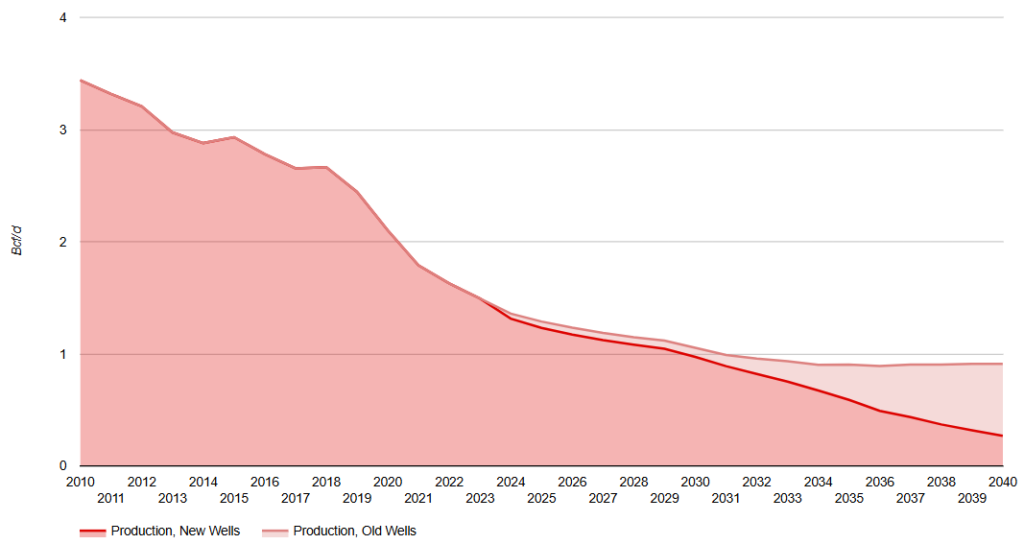
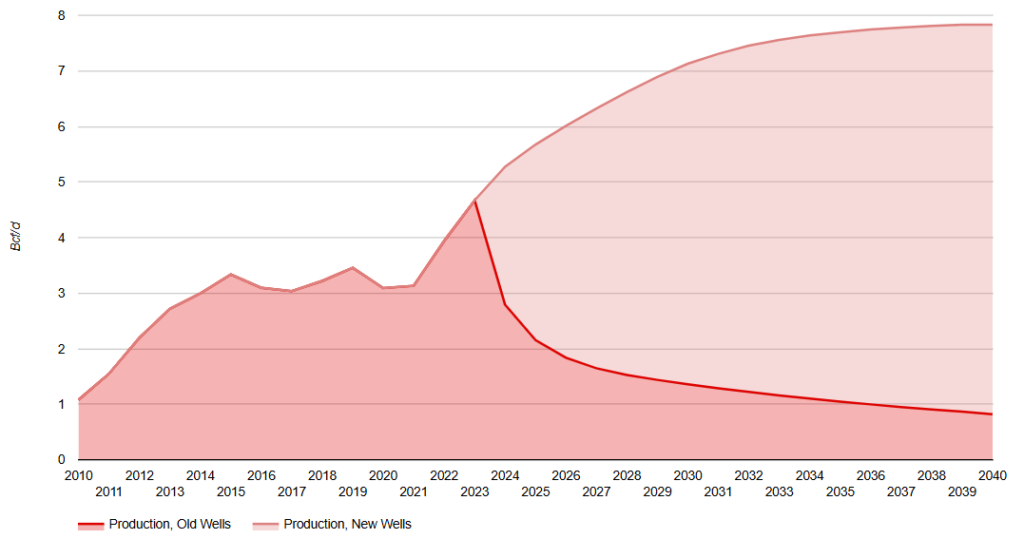
Green River Raw Natural Gas Production Forecast to 2040
Forecast to 2040 of the raw natural gas production for Green River (located primarily in Wyoming, extending into northern Colorado). Additional charts show corresponding initial productivity (IP), well count, estimated ultimate recovery (EUR) and a drilling map of the area. Green River raw gas production dropped to around 1.5 Bcf/d in 2023 and is expected to continue to fall reaching 0.9 Bcf/d by 2033.
February 15, 2025
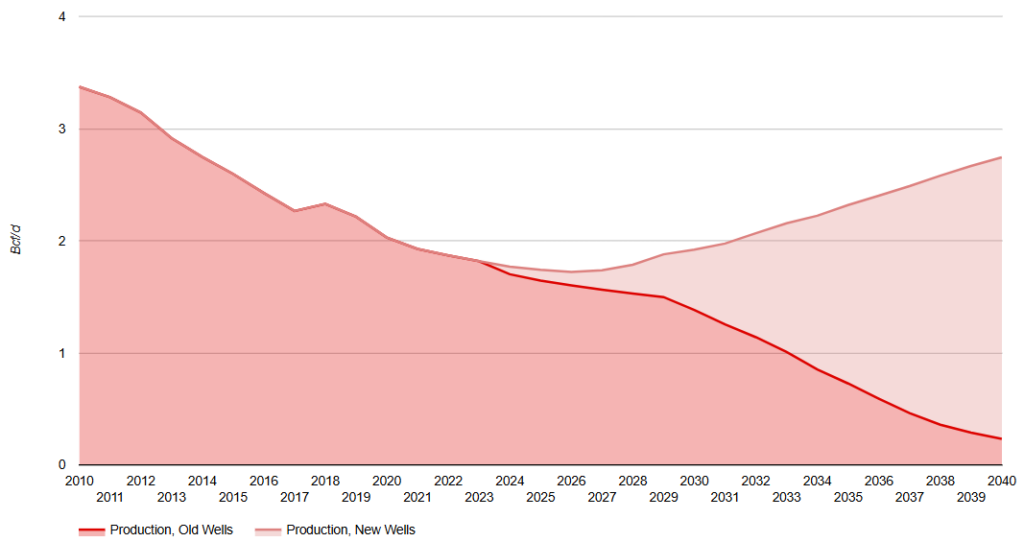
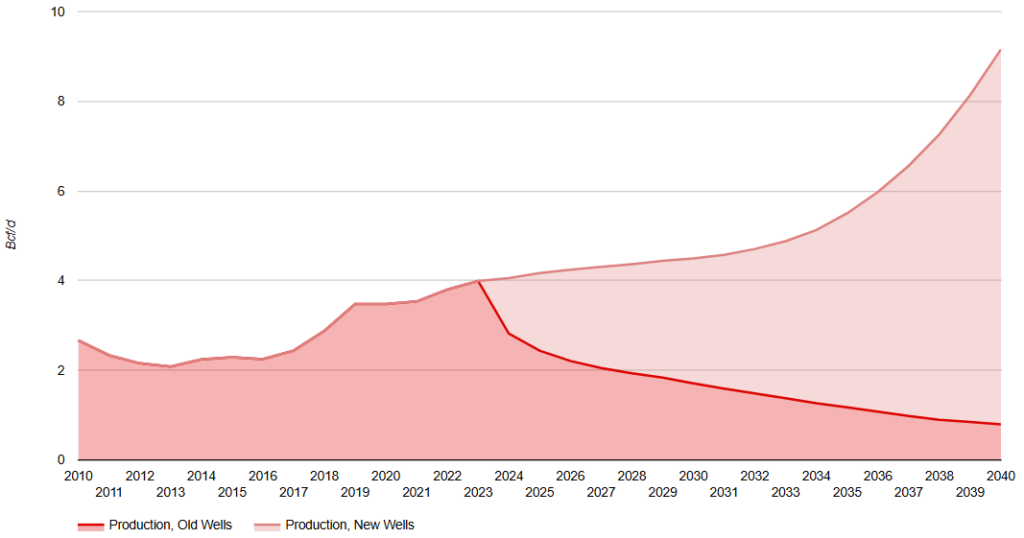
San Juan Raw Natural Gas Production Forecast to 2040
Forecast to 2040 of the raw natural gas production for San Juan ( located northwestern New Mexico extending into southwest Colorado). Additional charts show corresponding initial productivity (IP), well count, estimated ultimate recovery (EUR) and a drilling map of the area. San Juan raw gas production dropped steadily to about 1.8 Bcf/d in 2023, due to declines in coalbed methane production, and is expected to continue to fall for a few more years and then grow to 1.9 Bcf in 2030 and 2.4 Bcf/d in 2040.
February 14, 2025
Eagle Ford Raw Natural Gas Production Forecast to 2040
Forecast to 2040 of the raw natural gas production for Eagle Ford (located in south Texas). Additional charts show corresponding initial productivity (IP), well count, estimated ultimate recovery (EUR) and a drilling map of the area. Eagle Ford has oil, condensate and natural gas areas. Currently, drilling is conducted towards oil and liquids rich gas although drilling is expected to shift toward areas with smaller liquids yield during the forecast period.
February 14, 2025
Permian Raw Natural Gas Production Forecast to 2040
Forecast to 2040 of the raw natural gas production for Permian (located in Texas and southeastern New Mexico). Additional charts show corresponding initial productivity (IP), well count, estimated ultimate recovery (EUR) and a drilling map of the area. Permian is primarily an oil basin which produces condensate and natural gas with varying liquids yield. Currently, most drilling is focused on oil, however, oil production will start to decline during the forecast period due to maturity of the basin. At this point, the drilling for natural gas is expected to increase.
February 14, 2025
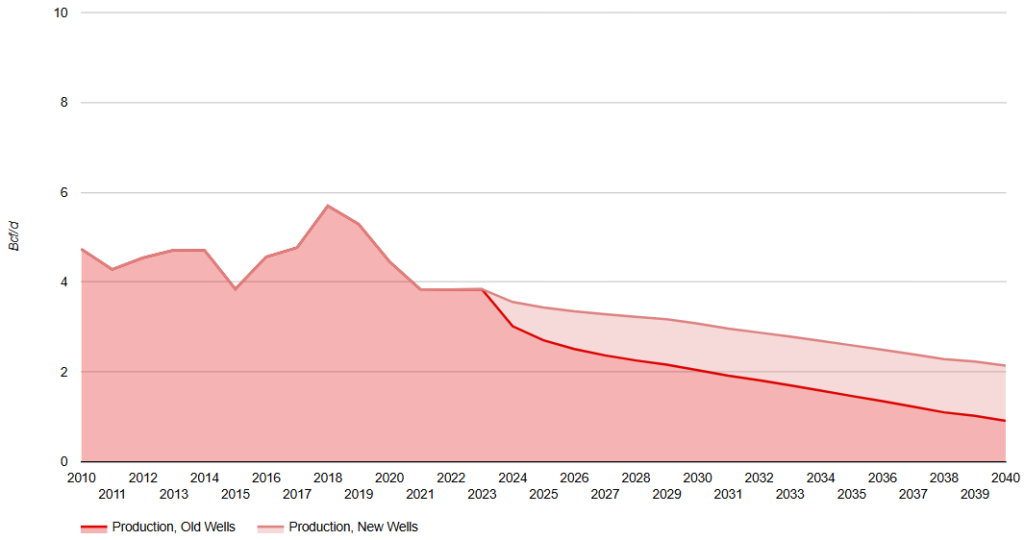
Anadarko Raw Natural Gas Production Forecast to 2040
Forecast to 2040 of the raw natural gas production for Anadarko (located in western Oklahoma and NE Texas, extending to SW Kansas and SE Colorado). Additional charts show corresponding initial productivity (IP), well count, estimated ultimate recovery (EUR) and a drilling map of the area. Anadarko production reached almost 5.7 Bcf/d in 2018 before starting a downward trend. Incorrys id forecasting production to decline to just 2.1 Bcf/d by 2040.
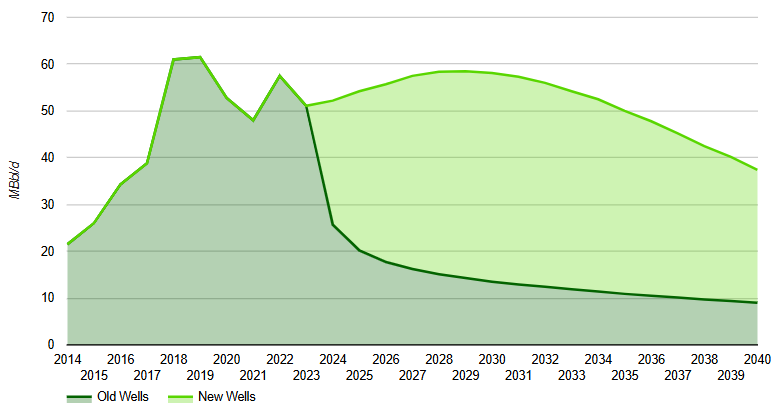
February 12, 2025
Utica Raw Natural Gas Production Forecast to 2040
Forecast to 2040 of the raw natural gas production for Utica (located primarily in East Ohio plus some in NE and SW Pennsylvania, partially overlapping Marcellus Shale). Additional charts show corresponding initial productivity (IP), well count, estimated ultimate recovery (EUR) and a drilling map of the area. Utica production growth during the short period to 2017 was primarily targeting liquids yields, leading to lower full cycle costs due to the liquids (revenue) uplift. Incorrys expects the liquids rich targets to mature resulting in the full cycle of cost of dry gas being more comparable to other basins.
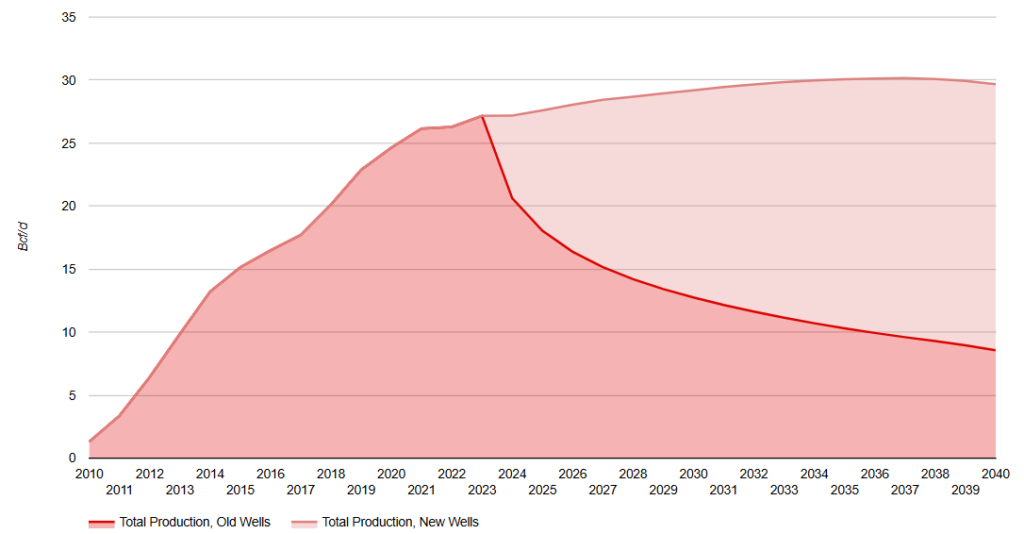
February 12, 2025
Marcellus Total Raw Natural Gas Production Forecast to 2040
Forecast to 2040 of the raw natural gas production for the total Marcellus area (located primarily in Pennsylvania and West Virginia and includes both the Marcellus NE and SW areas). Additional charts show well count and a drilling map of the area. Total Marcellus raw gas production was 27.2 Bcf/d in 2023 and is expected to reach 30.2 Bcf/d in 2037 before slowly declining over the last few years of the forecast.
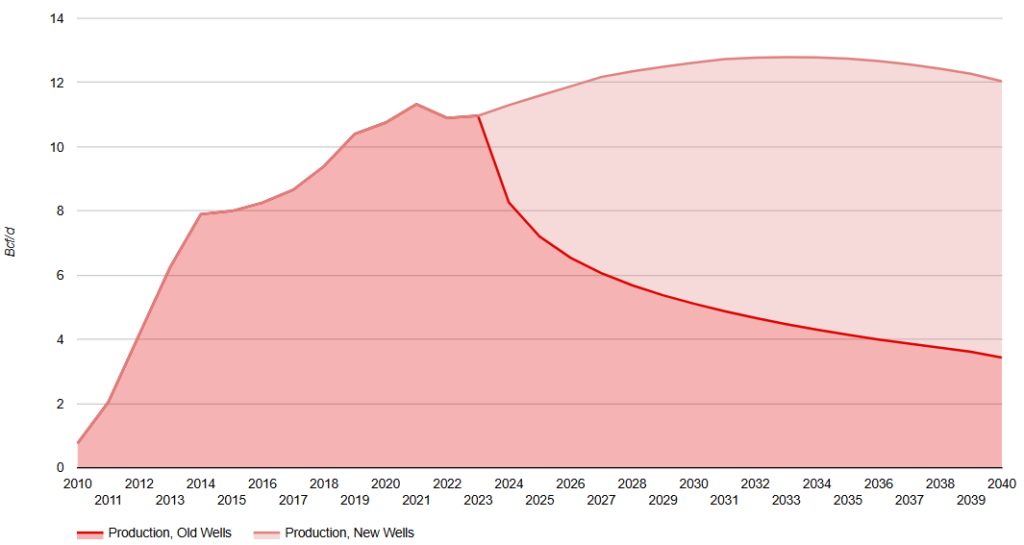
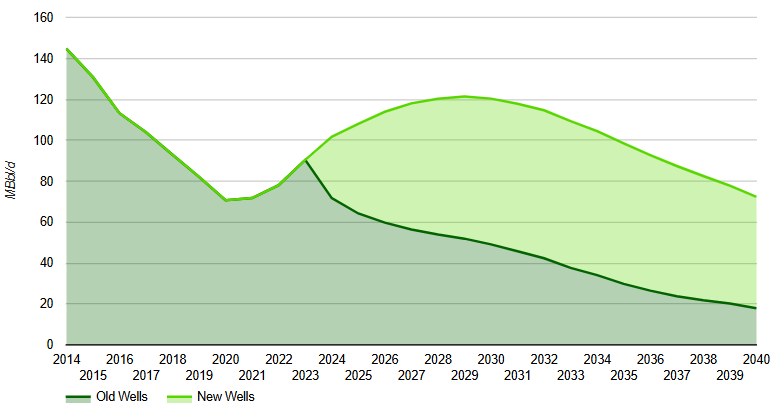
February 11, 2025
Marcellus NE Raw Natural Gas Production Forecast to 2040
Forecast to 2040 of the raw natural gas production for Marcellus NE (located in NE Pennsylvania), one of two major producing regions in Marcellus. Additional charts show corresponding initial productivity (IP), well count, estimated ultimate recovery (EUR) and a drilling map of the area. Marcellus NE produces mostly lean, dry gas and has new well initial productivity (IP) higher than in Marcellus SW. Natural gas production peaked at 11.3 Bcf/d in 2021 and is expected to continue to grow reaching 12.8 Bcf/d by 2032.
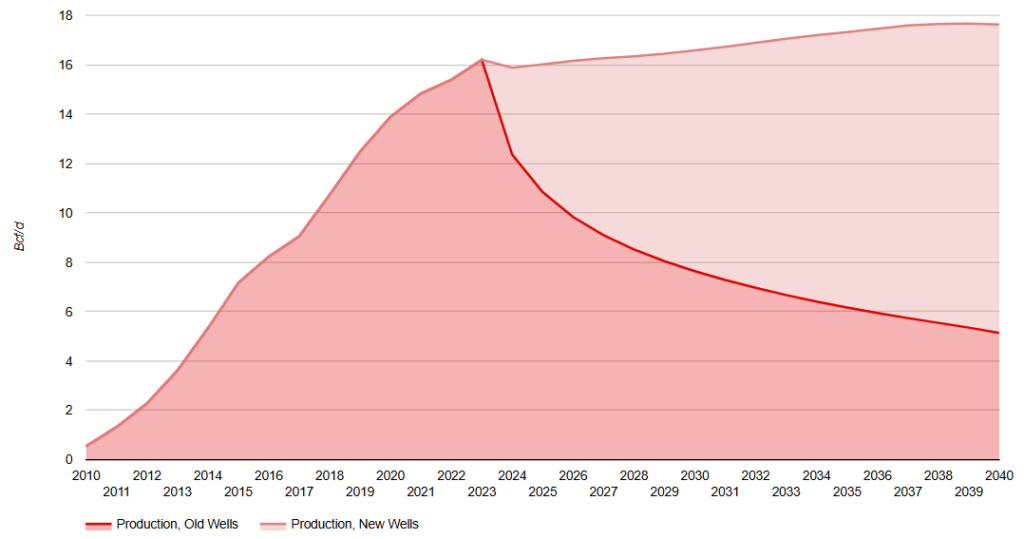
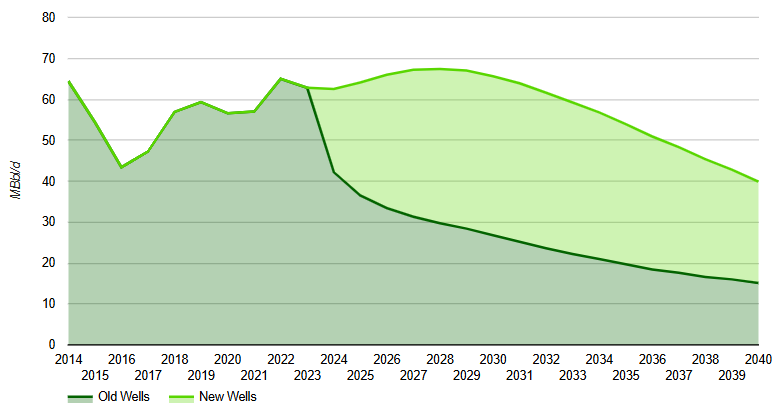
February 11, 2025
Marcellus SW Raw Natural Gas Production Forecast to 2040
Forecast to 2040 of the raw natural gas production for Marcellus SW (located in SW Pennsylvania and West Virginia), one of two major producing regions in Marcellus. Additional charts show corresponding initial productivity (IP), well count, estimated ultimate recovery (EUR) and a drilling map of the area. Marcellus SW produces liquids rich gas and includes a small ‘super’ rich area with liquids yield over 200 Bbl/MMcf. Natural gas production grows from 16.2 Bcf/d in 2023 to 17.7 Bcf/d in 2039.
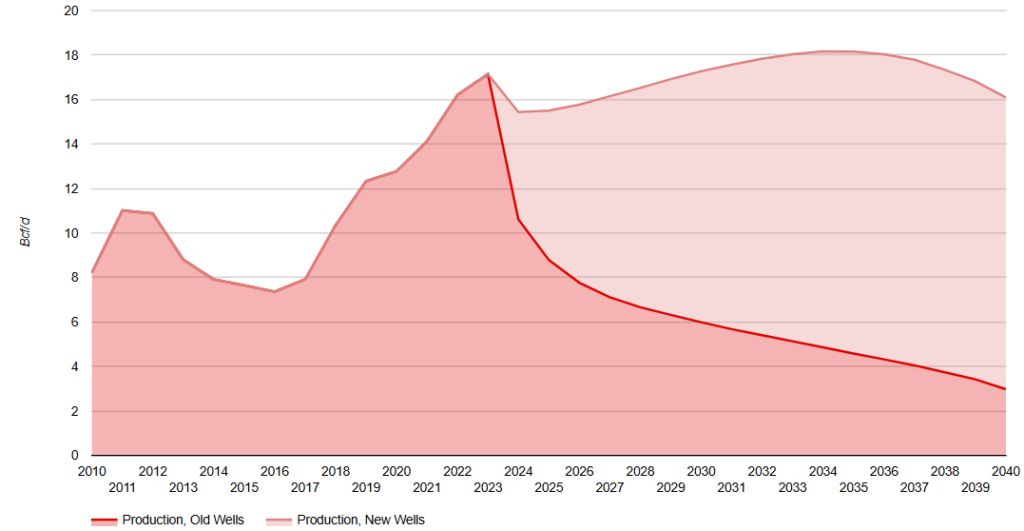
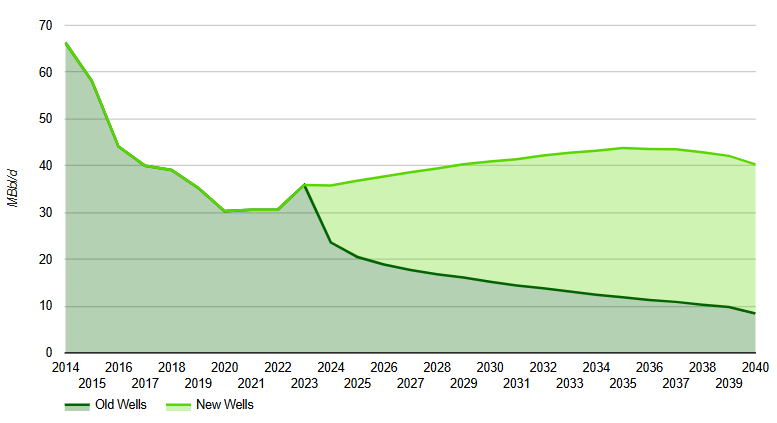
February 11, 2025
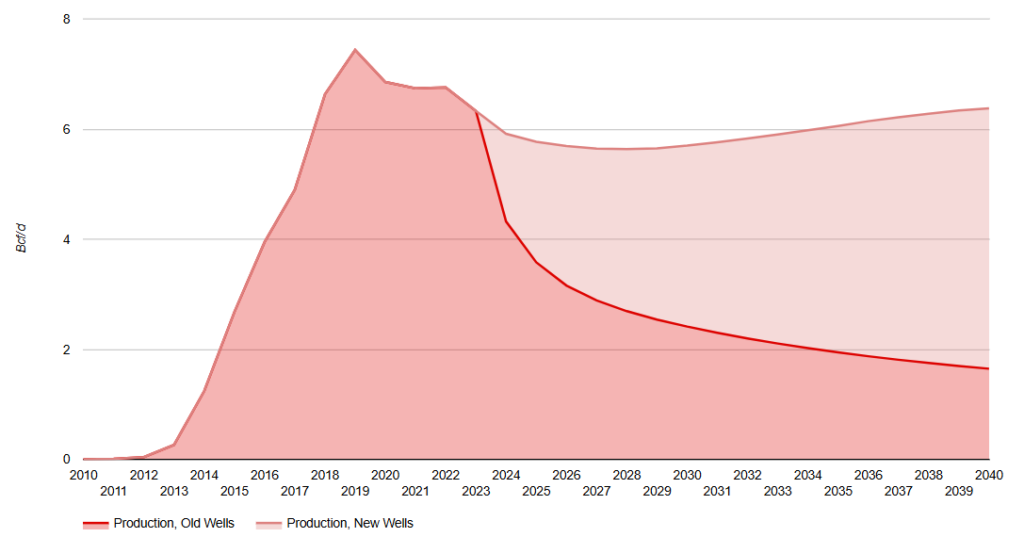
Haynesville Raw Natural Gas Production Forecast to 2040
Forecast to 2040 of the raw natural gas production for Haynesville (located in eastern Texas and northern Louisiana). Additional charts show corresponding initial productivity (IP), well count, estimated ultimate recovery (EUR) and a drilling map of the area. Proximity of LNG liquefaction plants located on the Gulf Coast makes Haynesville one of primary sources of gas for US LNG exports together with Permian Associated gas. Natural gas production was 16.7 Bcf/d in 2023 and is expected to reach over 18 Bcf/d around 2034.
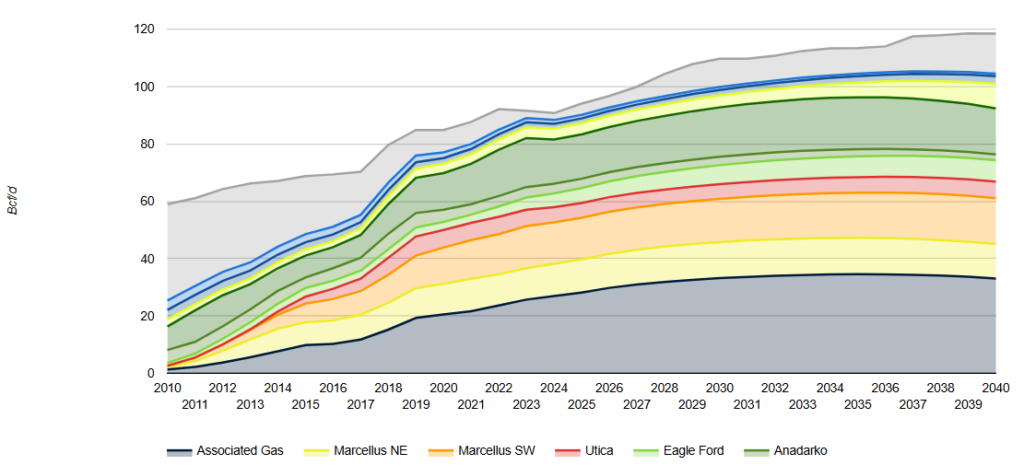
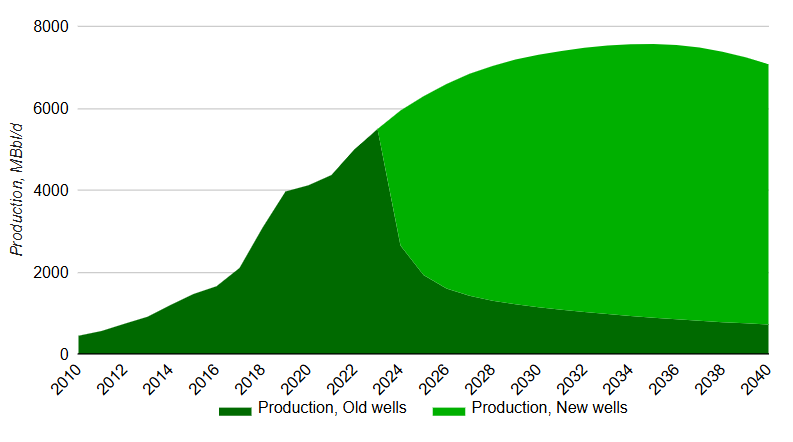
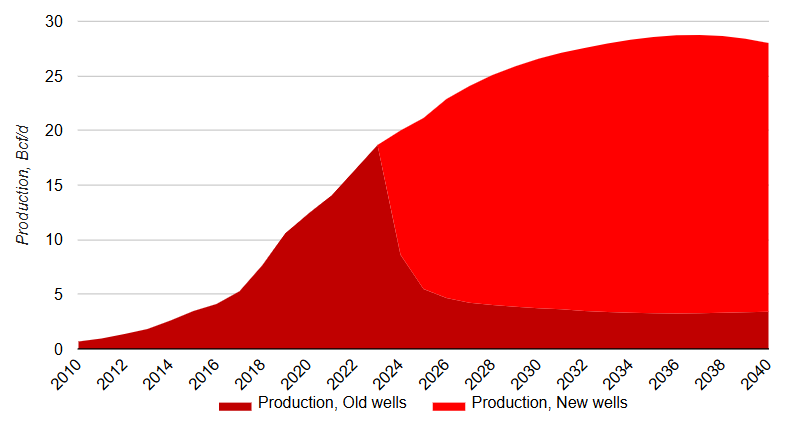
February 10, 2025
US Dry Natural Gas Production Forecast to 2040
US dry natural gas production forecast to 2040 by major US basin, including associated gas. US dry natural gas production grew from about 59 Bcf/d in 2010 to almost 92 Bcf/d in 2023. To meet future demand, Incorrys is forecasting production to continue to grow to almost 120 Bcf/d by 2040.
September 17, 2024
East Texas Oil Production Forecast to 2040
Forecast to 2040 of East Texas oil production (located in Southern Texas and Louisiana). Additional information showing a map of the region. The Texas–Louisiana coast is a conventional basin with declining production. Production peaked in 2015 at 20 Mbbl/d and is only 5 MBbl/d in 2023.
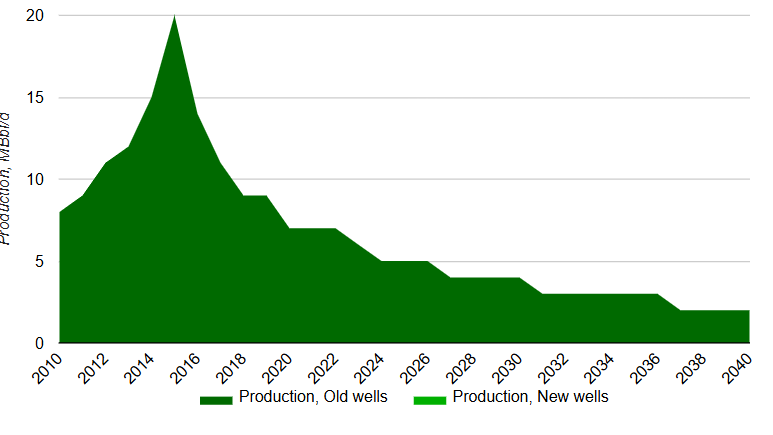
September 16, 2024
Niobrara Oil Production Forecast to 2040
Forecast to 2040 of Niobrara oil production (located in southern Powder River (Wyoming) and Denver-Julesburg (Colorado) basins). Additional charts show initial productivity (IP), estimated ultimate recovery (EUR), number of wells and a map of the region. Denver-Julesburg production reached its peak of 580 MBbl/s in 2019 and is expected to continue a general downtrend to about 250 MBbl/d in 2040. Powder River production was 160 MBbl/d in 2023 and is expected to peak at close to 200 MBbl/d by 2028.
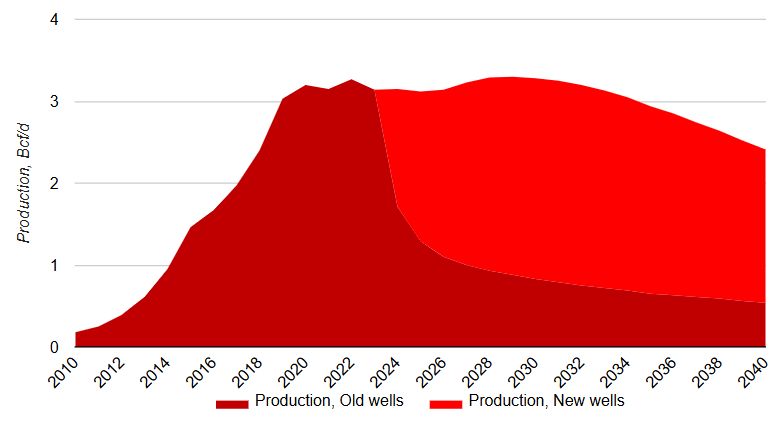
September 16, 2024
Niobrara Associated Gas Production Forecast to 2040
Forecast to 2040 of Niobrara raw associated gas production (Bcf/d). Additional charts show the breakdown between Denver-Julesburg and Powder River. Combined, Denver-Julesburg and Powder River associated gas production reached over 3 Bcf/d in 2023 and is expected to peak at about 3.3 Bcf/d around 2030.
September 16, 2024
Uinta Oil Production Forecast to 2040
Forecast to 2040 of Uinta oil production (located in Utah). Additional charts show initial productivity (IP), estimated ultimate recovery (EUR), number of wells and a map of the region. Uinta oil production grew to about 125 MBbl/d in 2023 and is expected to continue to grow during the forecast period and reach around 450 MBbl/d after 2035.
September 16, 2024
Anadarko Oil Production Forecast to 2040
Forecast to 2040 of Anadarko oil production (located in Oklahoma and Kansas). Additional charts show initial productivity (IP), estimated ultimate recovery (EUR), number of wells and a map of the region. Anadarko production reached almost 400 MBbl/d in 2019 before starting a downward trend as the relative economics of the basin is worse compared to Tight oil basins such as Willison and Permian.
September 16, 2024
Anadarko Associated Gas Production Forecast to 2040
Forecast to 2040 of Anadarko raw associated gas production (Bcf/d). Anadarko raw associated gas production peaked at 1.9 Bcf/d in 2019 and has generally decline since dropping to 1.4 Bcf/d in 2023.
September 16, 2024
Gulf of Mexico Offshore Oil Production Forecast to 2040
Forecast to 2040 of Gulf of Mexico offshore oil production. Additional charts show initial productivity (IP), number of wells and a map of the region. Incorrys forecasts Gulf of Mexico production based on analysis of new, announced, or under construction projects although there is significant uncertainty in new projects after 2028. Incorrys expects that Gulf of Mexico production will reach its peak of 1800 MBbl/d in 2026 and then start to decline reaching 1250 MBbl/d in 2040.
September 16, 2024
California Oil Production Forecast to 2040
Forecast to 2040 of California oil production (located in Kern County, San Joaquin Valley and the Los Angeles basin). Additional charts showing a map of the region. California production declined from 1,000 MBbl/d in the early 1980s to 325 MBbl/d in 2023. Production is expected to continue dropping to about just 75 MBbl/d in 2040.
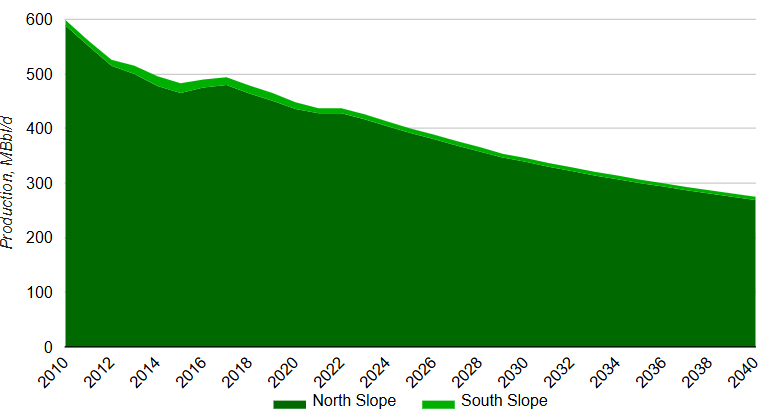
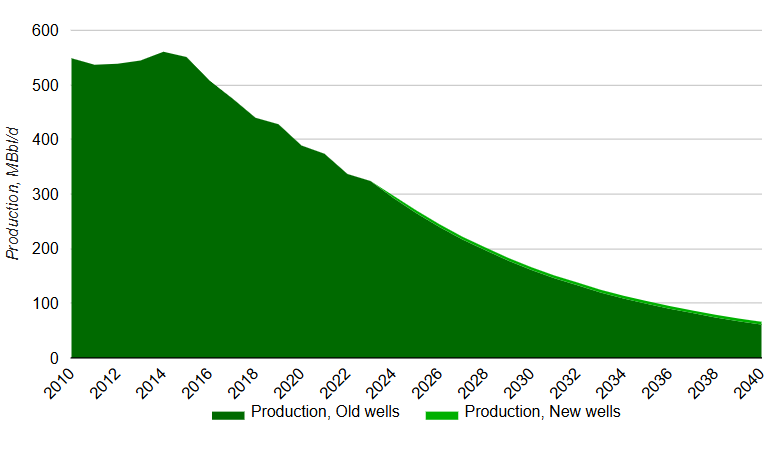
September 16, 2024
Alaska Oil Production Forecast to 2040
Forecast to 2040 of Alaska oil production (located in North and South Shore of Alaska). Additional charts show initial productivity (IP), number of wells and a map of the region. Alaska oil production, almost all of which comes from the North Slope, decreases from 600 MBbl/d in 2010 to 430 MBbl/d in 2023. Incorrys projects oil production to continue to decline reaching 275 MBbl/d in 2040. The production forecast does not include upside potential from Alaska LNG which, if it goes ahead, could boost oil drilling activity.
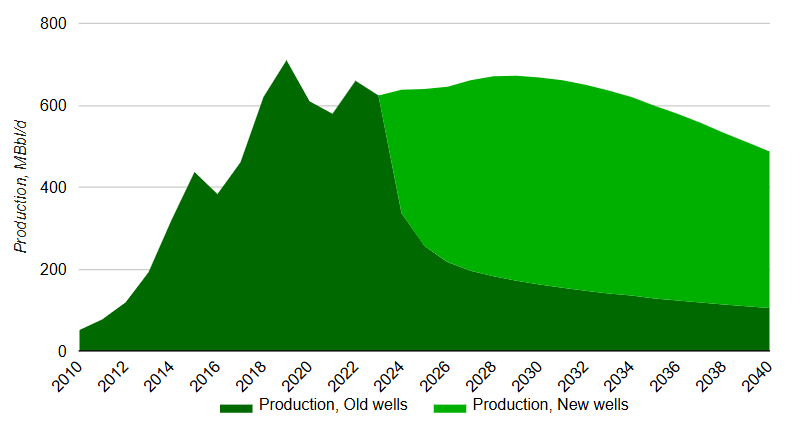
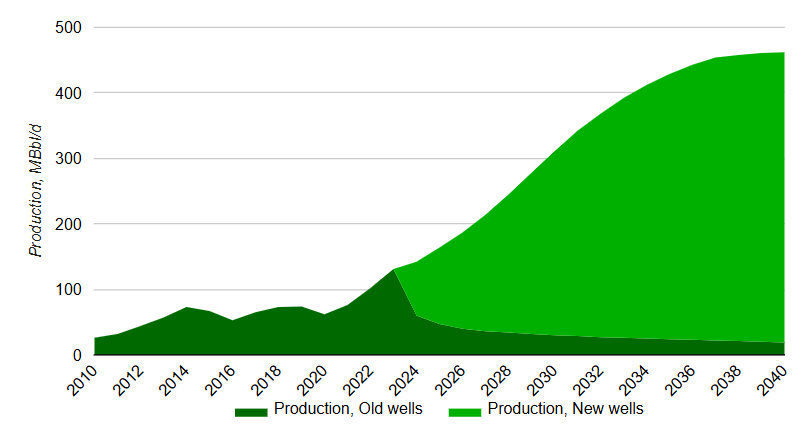
September 15, 2024
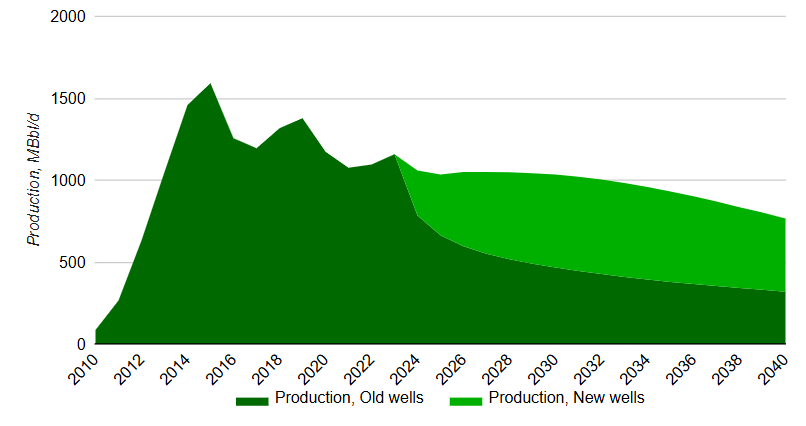
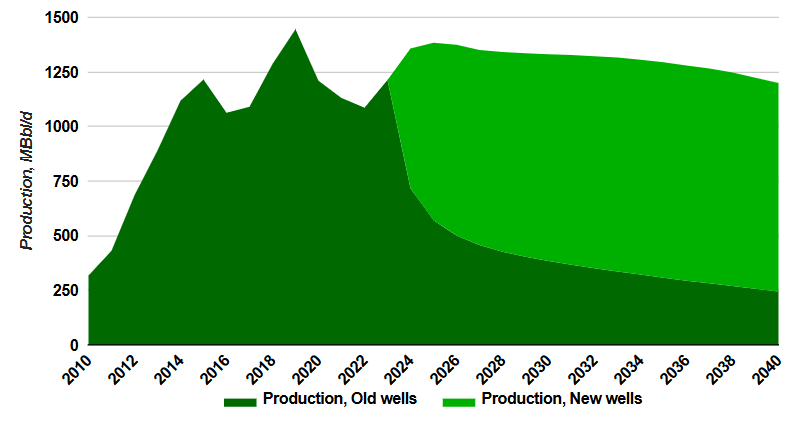
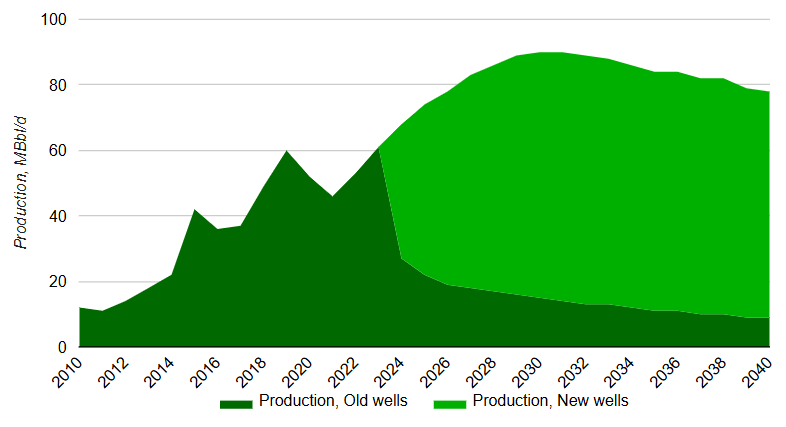
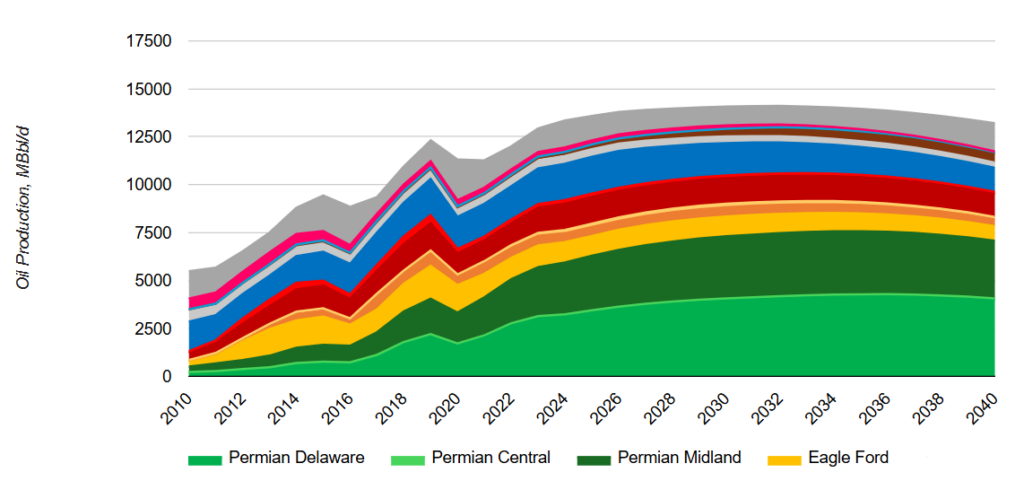
Permian Oil Production Forecast to 2040
Forecast to 2040 of Permian tight oil production (West Texas and Southeast New Mexico) by formation (Central Platform, Delaware, and Midland). Additional charts show initial productivity (IP), estimated ultimate recovery (EUR), number of wells and a map of the region. In 2023, Delaware was the largest producer of the formations at about 2,800 MBbl/d followed by Midland at about 2,500 and Central Platform, by far the smallest, at just 65 MBbl/d.
September 15, 2024
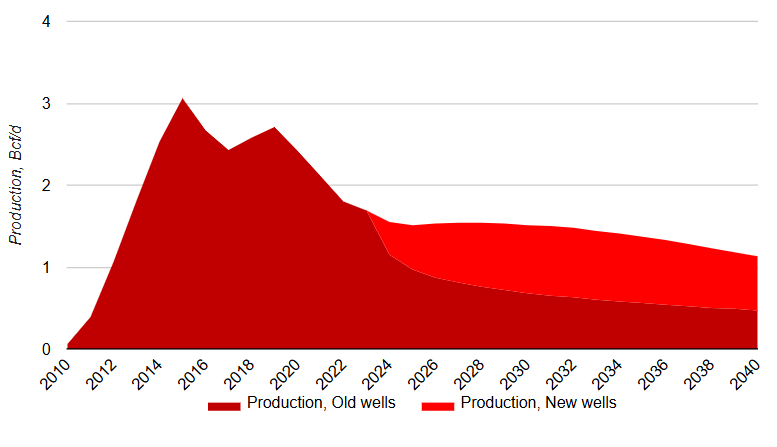
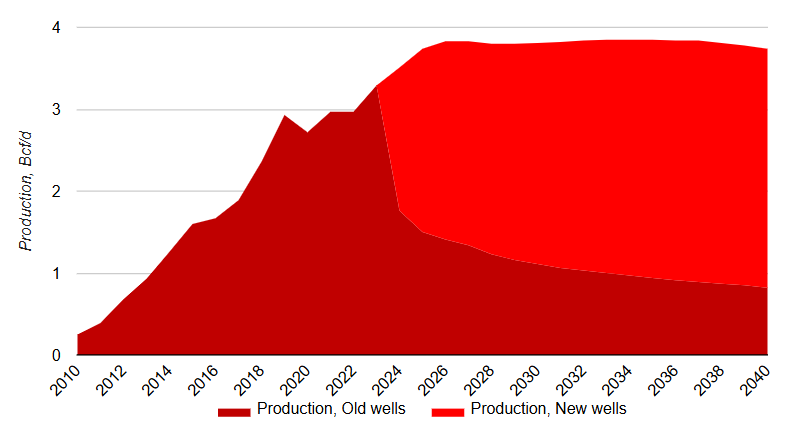
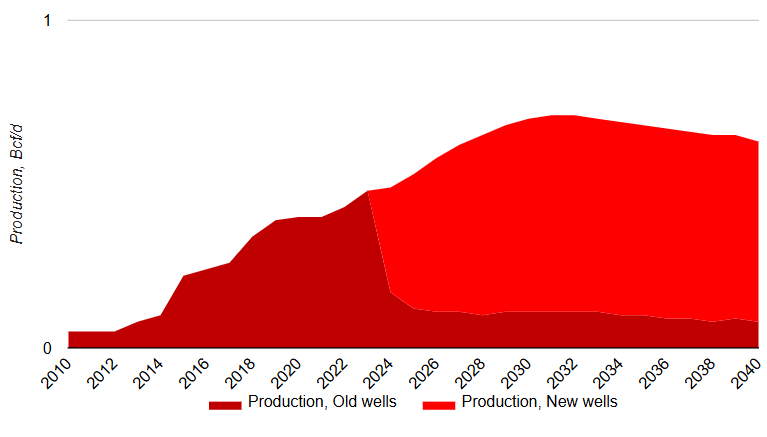
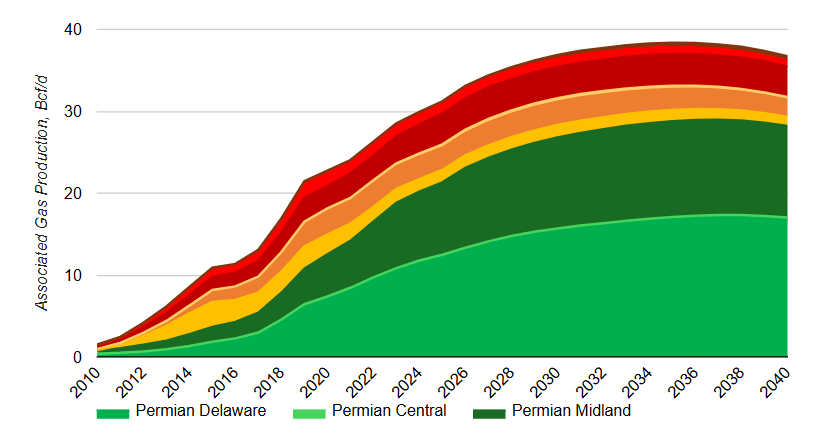
Permian Associated Gas Production Forecast to 2040
Forecast to 2040 of total Permian associated gas production (Bcf/d). Additional charts broken down by formation (Delaware and Midland). Total associated gas production from Permian grows from about 18 Bcf/d in 2023 to about 29 Bcf/d towards the end of the forecast period.
September 15, 2024
Eagle Ford Oil Production Forecast to 2040
Forecast to 2040 of Eagle Ford oil production (Texas). Additional charts show initial productivity (IP), estimated ultimate recovery (EUR), number of wells and a map of the region. Eagle Ford oil production was almost 1,200 MBbl/d in 2023 but is expected to decline to the 800 MBbl/d range by 2040 as the basin matures.
September 15, 2024
Eagle Ford Associated Gas Production Forecast to 2040
Forecast to 2040 of Eagle Ford associated gas production (Bcf/d). Eagle Ford raw associated gas production peaked at just over 3 Bcf/d in 2015 and has trended downward ever since due to the decline of oil production in the basin.
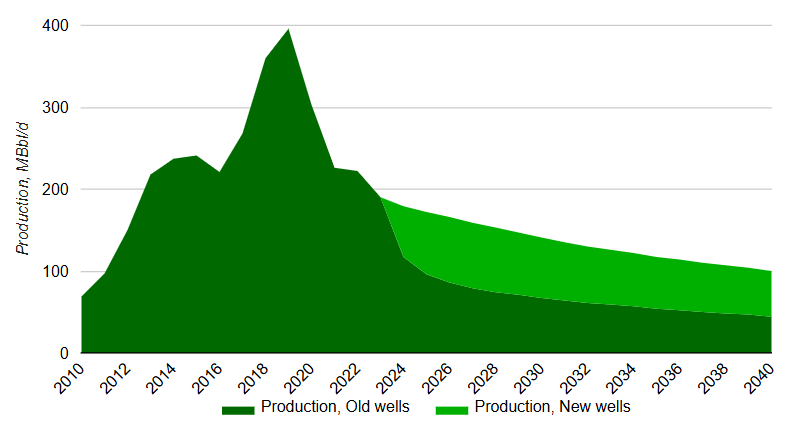
September 15, 2024
Forecast to 2040 of Williston oil production (North Dakota and Montana). Additional charts show initial productivity (IP), estimated ultimate recovery (EUR), number of wells and a map of the region.
Williston oil production peaked at over 1,400 MBbl/d in 2019 declining to 1,200 MBbl/d in 2023. Production recovers to close to the 2019 peak by 2025 before declining through the remainder of the forecast.
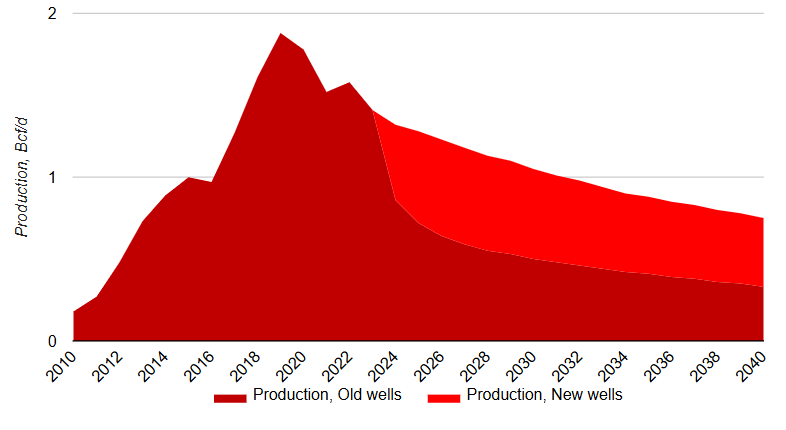
September 15, 2024
Williston Associated Gas Production Forecast to 2040
Forecast to 2040 of Williston associated gas production (Bcf/d). Williston raw associated gas production is expected to increase 0.5 Bcf/d between 2023 and 2026 to over 3.8 Bcf/d. It remains relatively flat through the remainder of the forecast.
September 15, 2024
Appalachian Oil Production Forecast to 2040
Forecast to 2040 of Appalachian oil production (Pennsylvania, Ohio, West Virginia, Kentucky). Additional charts show initial productivity (IP), estimated ultimate recovery (EUR), number of wells and a map of the region. Appalachian oil production grows from about 60 MBbl/d in 2023 to a peak of about 90 MBbl/d by 2031 before declining to under 80 MBbl/d by 2040.
September 15, 2024
Appalachian Associated Gas Production Forecast to 2040
Forecast to 2040 of Appalachian associated gas production (Bcf/d). Appalachian raw associated gas production will grow to over 0.7 Bcf/d in 2032 up from just under 0.5 Bcf/d in 2023 due to the growth of volatile oil production.
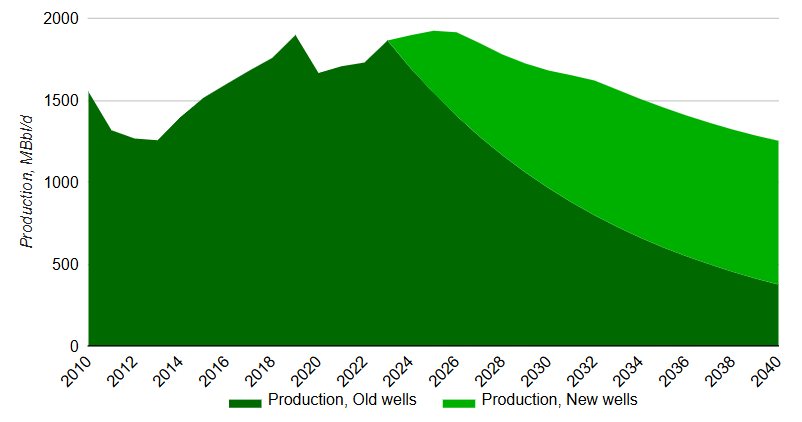
September 13, 2024
US Oil and Lease Condensate Production Forecast to 2040
Forecast of US crude oil and lease condensate production (MBbl/d) by major basin including Alaska and offshore. US crude oil and lease condensate production grew from about 5,500 MBbl/d in 2010 to 13,000 in 2023. Incorrys forecasts oil and lease condensate production will continue to grow peaking at about 14,000 MBbl/d by 2030.
September 13, 2024
US Raw Associated Gas Production Forecast to 2040
Forecast of US associated natural gas production (Bcf/d) by major basin. Associated gas production increased to 28.4 Bcf/d in 2023, up from 1.5 Bcf/d in 2010, driven by the increase in the gas/oil ratios within Tight Oil basins. Incorrys estimates associated gas production to reach almost 38 Bcf/d in the 2031-2037 timeframe.
September 13, 2024
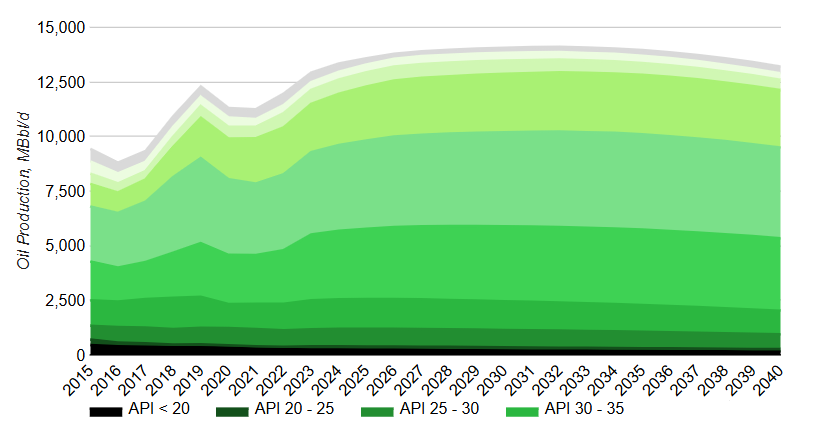
US Crude Oil vs Lease Condensate Production Forecast to 2040
Production forecast of crude oil vs lease condensate to 2030 broken down by API (American Petroleum Institute) gravity (lease condensate is defined as field liquids production with API greater than 45 degrees). Lease condensate accounted for 26% of total oil production at about 3,200 MBbl/d in 2023, up from 23% (2,000 MBbl/d) in 2015. The increase is due to focused drilling in condensate rich Tight Oil Basins.
August 20, 2024
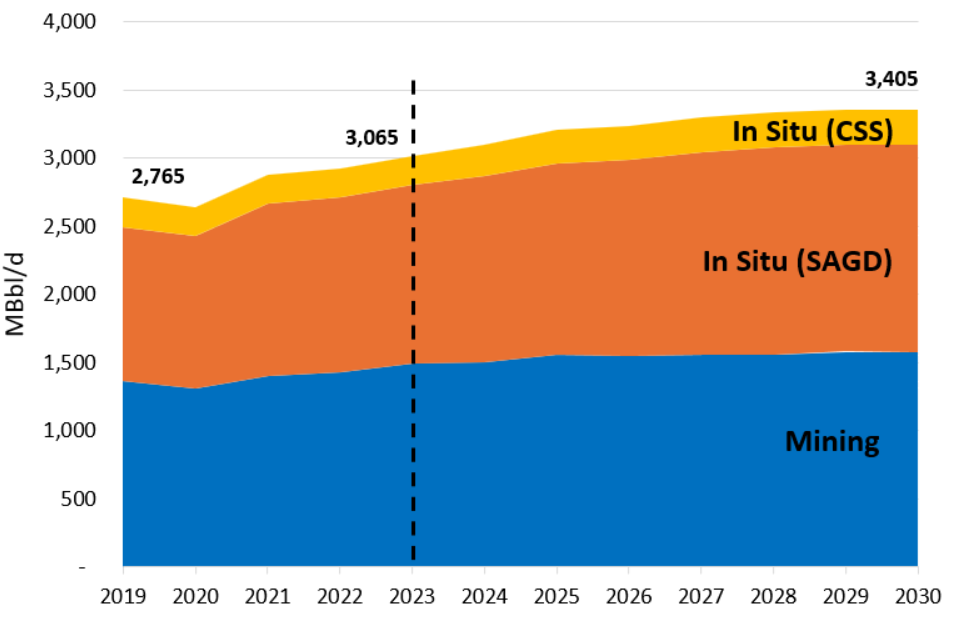
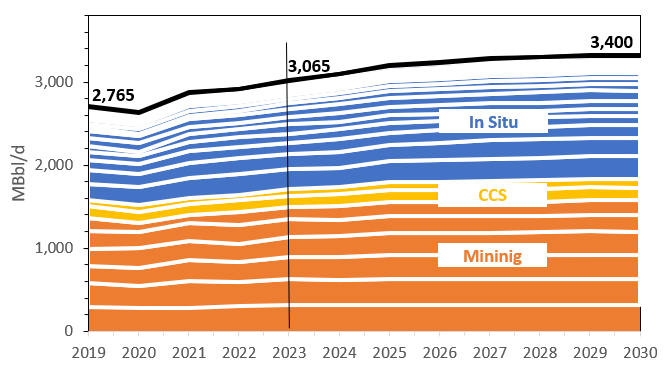
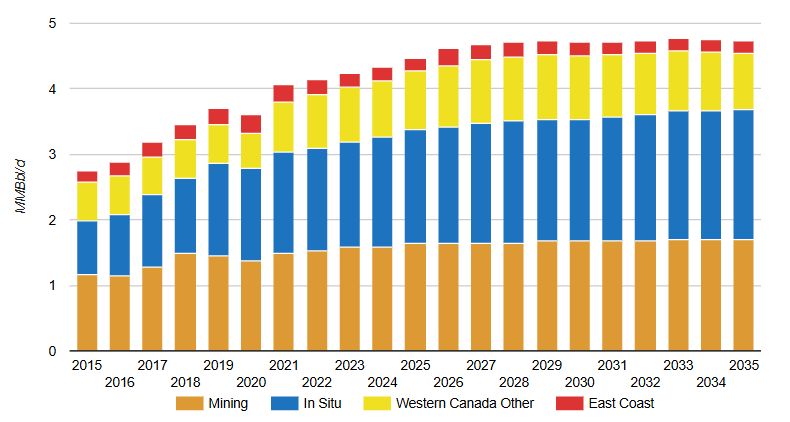
Oil Sands Production Forecast to 2030 by Type
Alberta oil sands production forecast (MBbl/d) to 2030 by type (mining vs in situ (SAGD and CSS)). Additional illustrative map showing the approximate location of the oil sands deposits. After posting a 2.6% per year growth rate from 2019 to 2023, Incorrys forecasts Canadian oil sands growth to slow with the completion of new large scale mining projects. Incorrys now forecasts an average annual growth rate of 1.5% (from 3.1MM Bbl/d in 2023 to 3.4MM Bbl/d in 2030).
July 16, 2024
Alberta Central Oil Production Forecast to 2040
Alberta Central oil production (MBbl/d) history and forecast to 2040. Additional charts on Initial Productivity (IP), Estimated Ultimate Recovery (EUR), number of wells ,and map of the drilling region. Alberta Central oil production grew from about 23,000 Bbl/d in 2014 to 30,000 Bbl/d. Incorrys is forecasting production to continue to grow post 2024 peaking at 34,000 Bbl/d by 2028 before declining to under 25,000 Bbl/d in 2040.
July 16, 2024
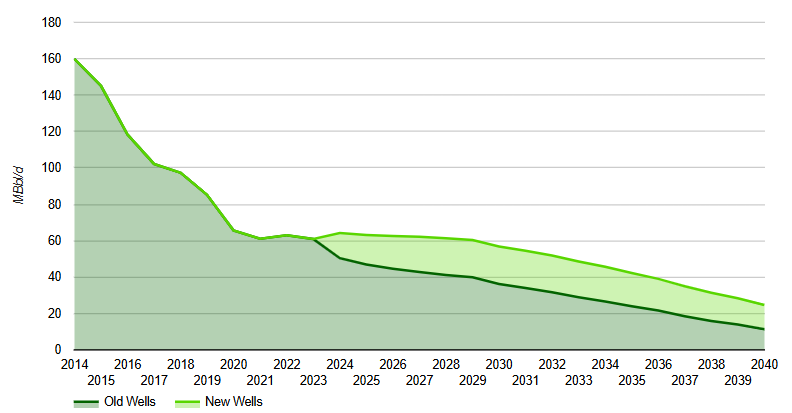
Alberta East Heavy Oil Production Forecast to 2040
Alberta East Heavy oil production (MBbl/d) history and forecast to 2040. Additional charts on Initial Productivity (IP), Estimated Ultimate Recovery (EUR), number of wells ,and map of the drilling region. Alberta East Heavy oil production has steadily declined from 160,000 Bbl/d in 2014 to about 60,000 Bbl/d in 2023. Incorrys is forecasting production to increase slightly in 2024 before declining to 25,000 Bbl/d in 2040.
July 16, 2024
Alberta North Oil Production Forecast to 2040
Alberta North oil production (MBbl/d) history and forecast to 2040. Additional charts on Initial Productivity (IP), Estimated Ultimate Recovery (EUR), number of wells ,and map of the drilling region. Alberta North oil production declined from over 140,000 Bbl/d in 2014 to about 70,000 Bbl/d in 2020 before rebounding to 90,000 Bbl/d in 2023. Incorrys is forecasting production to increase to over 120,000 Bbl/d in 2029 before dropping to 70,000 Bbl/d in 2040.
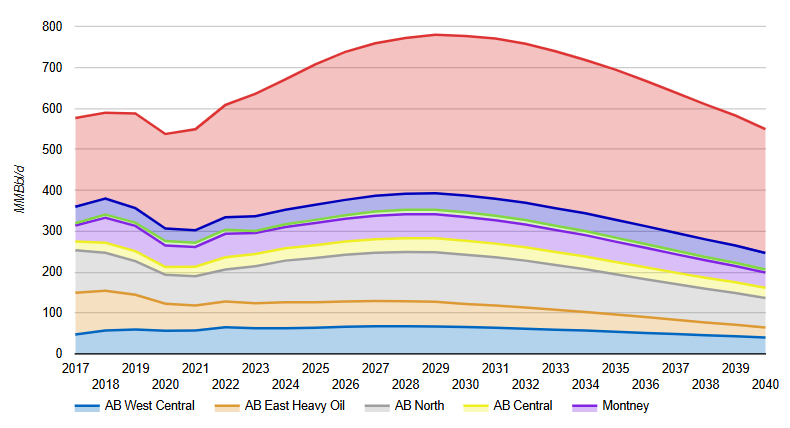
July 16, 2024
Alberta West Central Oil Production Forecast to 2040
Alberta West Central oil production (MBbl/d) history and forecast to 2040. Additional charts on Initial Productivity (IP), Estimated Ultimate Recovery (EUR), number of wells ,and map of the drilling region. Alberta West Central oil production declined from 65,000 Bbl/d in 2014 to a low of about 45,000 Bbl/d in 2016 before rebounding in 2023. Incorrys is forecasting production to increase to almost 70,000 Bbl/d in 2029 before dropping to 40,000 MBbl/d in 2040.
![]()
July 12, 2024
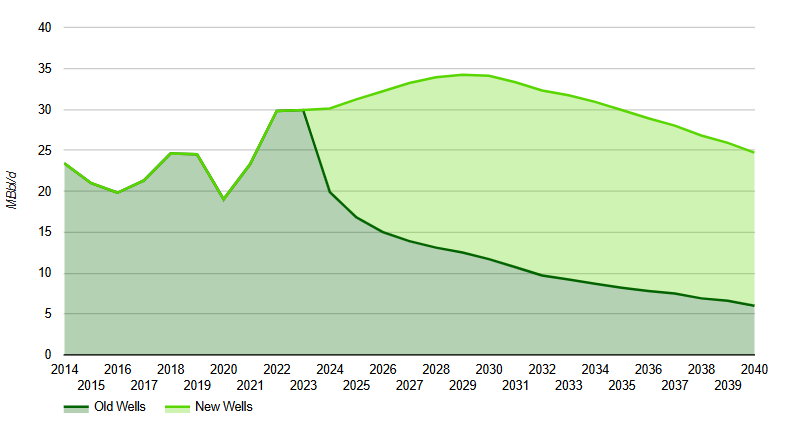
Clearwater Oil Production Forecast to 2040
Clearwater oil production (MBbl/d) history and forecast to 2040. Additional charts on Initial Productivity (IP), Estimated Ultimate Recovery (EUR), number of wells ,and map of the drilling region. Clearwater oil production grew from about 200,000 Bbl/d in 2014 to 300,000 Bbl/d in 2023. Incorrys is forecasting production to continue to grow post 2023 peaking at over 390,000 Bbl/d in 2031 before declining to 2023 levels by 2040.
July 12, 2024
Cardium Oil Production Forecast to 2040
Cardium oil production (MBbl/d) history and forecast to 2040. Additional charts on Initial Productivity (IP), Estimated Ultimate Recovery (EUR), number of wells ,and map of the drilling region. Oil production from the Cardium declined from about 65,000 Bbl/d in 2014 to 36,000 Bbl/d in 2023. Incorrys is forecasting production to grow post 2023 to almost 45,000 Bbl/d before declining to 40,000 Bbl/d in 2040.
July 12, 2024
Montney Oil Production Forecast to 2040
Montney oil production (MBbl/d) history and forecast to 2040. Additional charts on Initial Productivity (IP), Estimated Ultimate Recovery (EUR), number of wells ,and map of the drilling region. Montney oil production grew from about 20,000 Bbl/d in 2014 to over 50,000 Bbl/d in 2023. Incorrys is forecasting production to continue to grow post 2023 peaking at almost 60,000 Bbl/d by 2028 before declining to 37,000 Bbl/d in 2040.
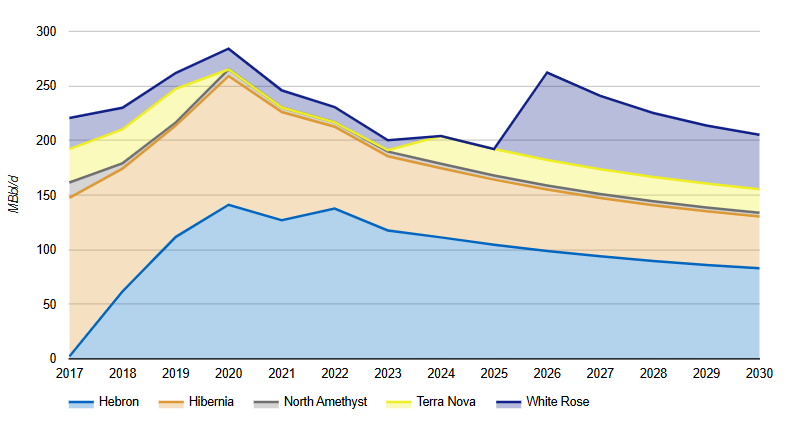
July 11, 2024
Canadian East Coast Offshore Oil Production Forecast to 2030
Total Canadian offshore oil production and forecast by major field. Additional chart showing individual field production. Canadian Offshore oil production, located east of Newfoundland, grew rapidly from 220 to 260 MBbl/d in 2019. Offshore production has since dropped to 200 MBbl/d in 2023 due to well declines for all projects. Although Incorrys is forecasting additional supply from White Rose in 2026 generally, offshore oil production continues to decline throughout the forecast period.
July 11, 2024
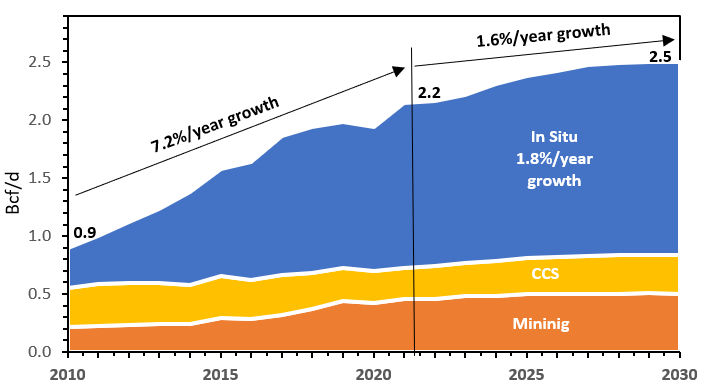
Natural Gas Requirements for Oil Sands Forecast to 2030
Demand forecast to 2030 for western Canada’s oil sands mining, carbon capture & storage (CCS), and in-situ natural gas requirements. Natural gas requirements for Canadian oil sands grew at an average annual rate of 7.2% from 2010 through 2023 from under 1 Bcf/d to 2.2 Bcf/d. Incorrys is forecasting annual growth in oil sands natural gas demand to slow to 1.6% from 2023 to 2030 as the rate of in situ slows.
July 10, 2024
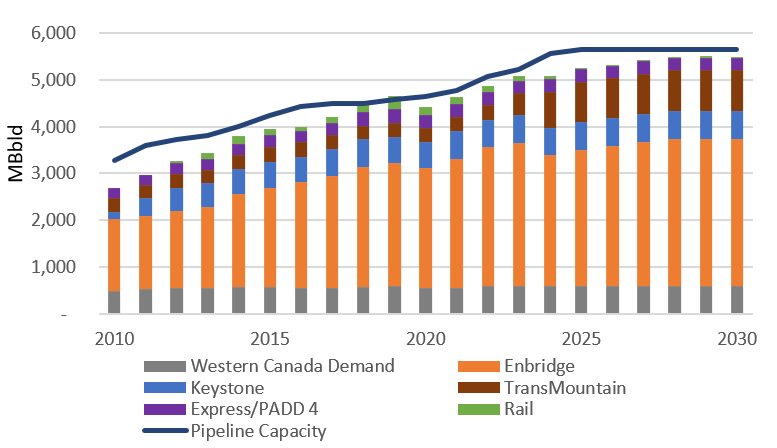
Canadian Oil Pipelines & Western Canada Flows
Flows of western Canadian oil by pipeline, rail, and intra-Alberta demand versus total pipeline capacity. Additional illustration showing Canada’s oil pipeline network. In the near term, oil production in excess of demand and pipeline capacity will be transported to market by rail. With incremental new pipe completed in 2022, rail shipments are not required until 2027.
July 9, 2024
Oil Sands Production Forecast to 2030 by Project
Alberta oil sands production forecast (MBbl/d) to 2030 by project. Additional illustrative map showing the approximate location of the oil sands deposits and pipeline system. After posting a 2.6% per year growth rate from 2019 to 2023, Incorrys forecasts Canadian oil sands growth to slow with the completion of new large scale mining projects. Incorrys now forecasts an average annual growth rate of 1.5% (from 3.1MM Bbl/d in 2023 to 3.4MM Bbl/d in 2030).
July 9, 2024
Alberta Oil Production Forecast to 2040 (excl Oil Sands)
Historical and forecast to 2040 of Alberta oil supply (MMBbl/d) by major basin (excluding oil sands) which includes wells classified as volatile oil, oil and heavy oil but excludes wells classified as Condensate and Bitumen. Clearwater remains the largest source of Alberta conventional and tight oil production, accounting for over 50% of future production through 2040.
July 8, 2024
Canadian Oil Production Forecast to 2035
Historical and forecast to 2035 of Canadian oil supply (MMBbl/d) by type; conventional onshore, offshore, and oil sands (further split between mining and in situ). Looking to 2035, Incorrys is forecasting total Canadian oil production to continue to increase at about 2% annually through 2028 before leveling off for the remainder of the forecast period, averaging just 0.8% annually.
January 12, 2024
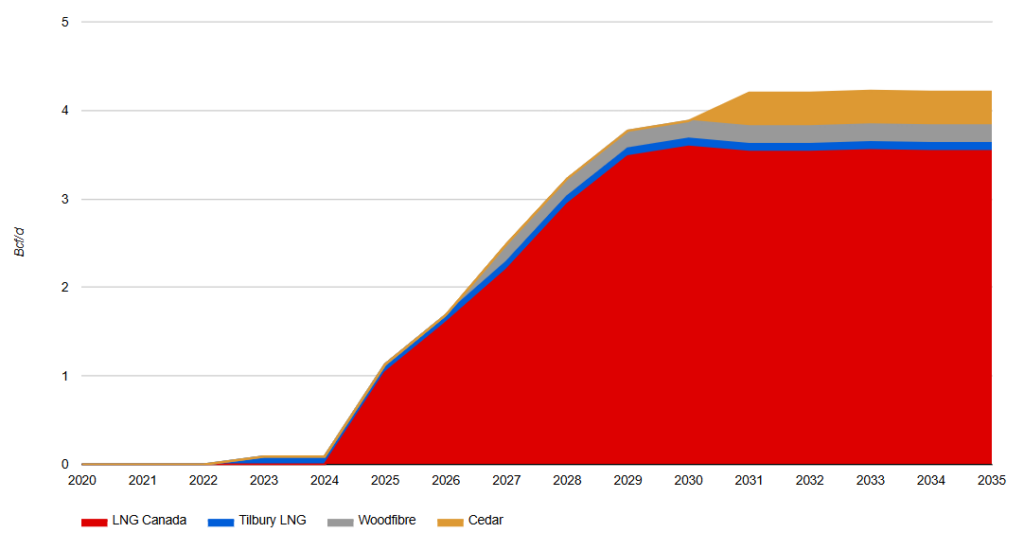
Canadian LNG Exports to 2035
Forecast to 2035 of Canadian liquefied natural gas (LNG) exports led by Shell’s LNG Canada facility on the west coast. Also discusses the impact LNG Canada will have on Canada’s supply/demand. Additional map showing the locations and pipelines supplying facilities. LNG exports are the largest Canadian demand driver over the last half of the decade as LNG Canada is expected to begin exporting in 2025. Completion of LNG Canada’s second train moves their total demand to 3.6 Bcf/d by 2030 and, coupled with the 0.3 Bcf/d from two smaller terminals (Tilbury and Woodfibre) in BCs lower mainland yields total Canadian LNG exports of 3.9 Bcf/d by 2030.
January 11, 2024
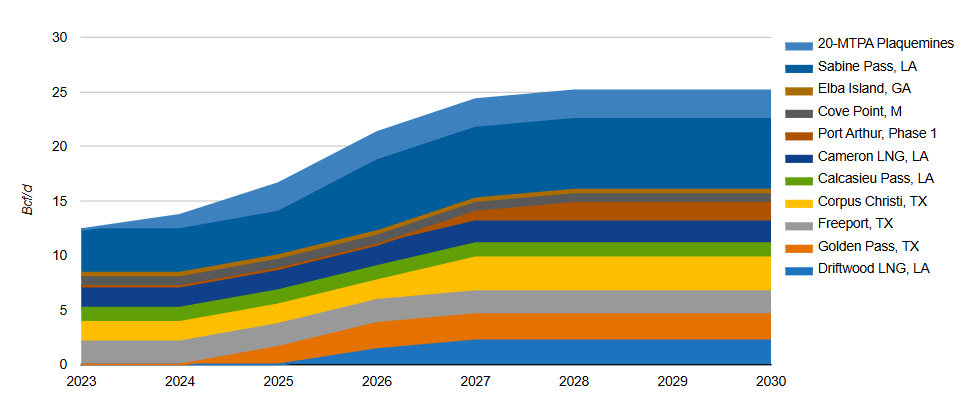
US LNG Exports to 2030
Forecast to 2030 of North American liquified natural gas (LNG) exports from 9 US and 1 Canadian facility. Additional map showing the locations of the facilities. LNG Exports are expected to increase over the next decade as Henry Hub pricing continues to offer worldwide buyers the ability to transact in a highly liquid and transparent market.
January 11, 2024
Liquefaction Capacity by Country (2028)
Global LNG liquefaction capacity stood at 476 mtpa (62 Bcf/d) by 2022. In July 2023, projects totaling 207 mtpa(27 Bcf/d) are being developed globally.
January 9, 2024
Global Liquefaction Capacity Growth 2022-2028
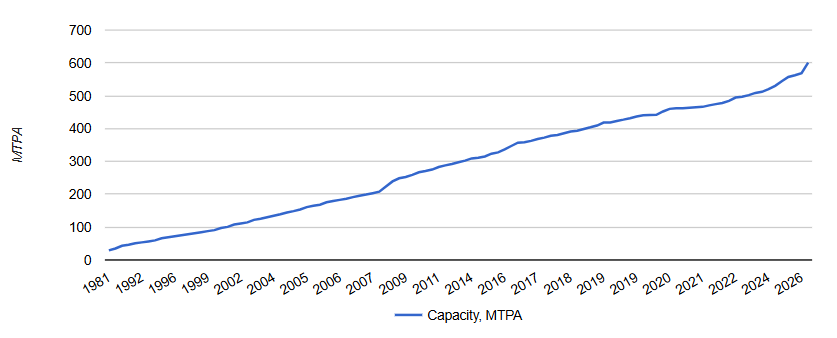
Global LNG liquefaction capacity growth from 2022-2028 in mtpa and Bcf/d equivalent. Additional charts showing 2022 LNG exports by country and 2028 liquefaction capacity by country. A total of almost 20 million tons per annum (mtpa) of new LNG liquefaction capacity was brought online in 2022, pushing the global total to over 475 mtpa, a 4% increase over the 456 mtpa in 2021. In total, global liquefaction capacity is expected to reach almost 685 mtpa (about 90 Bcf/d of natural gas) in 2028, up over 200 mtpa (~40%) from 2022.
July 7, 2023
Canadian Natural Gas Supply-Demand Balance Forecast to 2030
Overview of the Canadian natural gas supply-demand balance for 2010, 2020, 2022, and 2030, showing the receipt and delivery volumes of natural gas by province and export/import points. The biggest changes in the Canadian supply-demand balance between 2010 and 2030 is competition with Marcellus shale gas limiting western Canadian supply into the eastern region and increased Alberta supply for liquefied natural gas exports from the west coast.
July 6, 2023
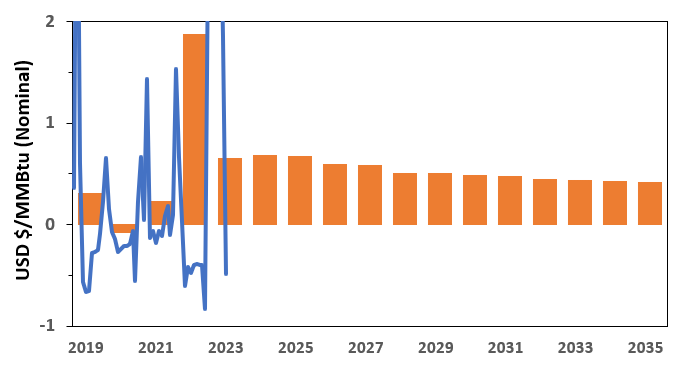
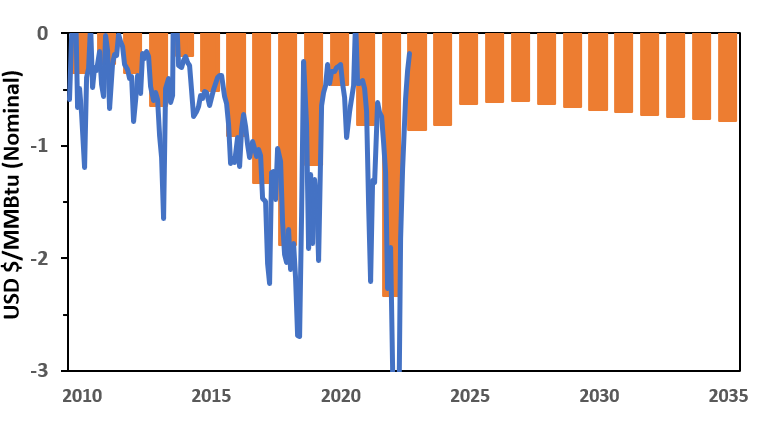
Dawn Basis and Price Forecast to 2035
Dawn actual and annual basis differentials relative to Henry Hub for 2010-2022 and Incorrys annual basis forecast for 2023-2035. Additional information includes the corresponding Dawn natural gas prices. This past winter proved difficult for Dawn/US Northeast pricing; colder than normal, competing with Europe for LNG availability, and high fuel oil pricing. A return to more normal weather conditions and better European supply security should bring more normalized pricing to Dawn.
July 6, 2023
Chicago Basis and Price Forecast to 2035
Chicago actual and annual basis differentials relative to Henry Hub for 2010-2022 and Incorrys annual basis forecast for 2023-2035. Additional information includes the corresponding Chicago natural gas prices. Chicago continues to be well supplied in summer and competes for natural gas supply in winter months.
July 6, 2023
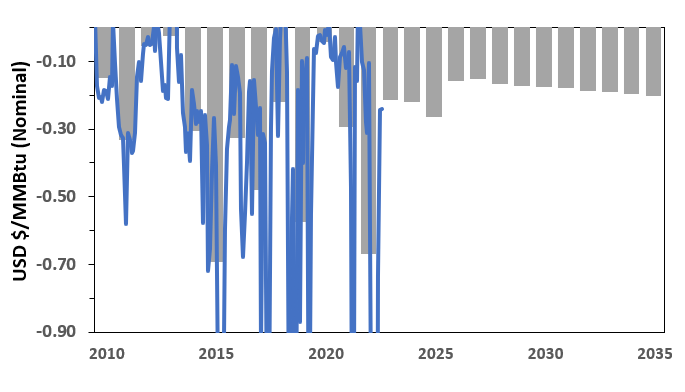
Malin Basis and Price Forecast to 2035
Malin actual and annual basis differentials relative to Henry Hub for 2010-2022 and Incorrys annual basis forecast for 2023-2035. Additional information includes the corresponding Malin natural gas prices. Strong basis as California and the Pacific NW continues to struggle with security of supply in meeting winter peak-day requirements due to lack of storage and pipeline development.
July 6, 2023
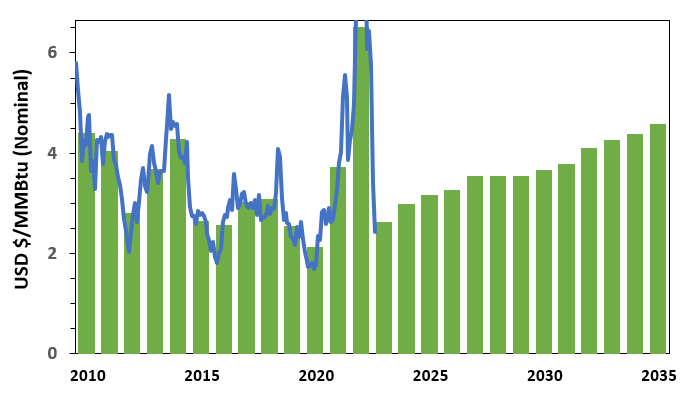
Station 2 Basis and Price Forecast to 2035
Station 2 actual and annual basis differentials relative to AECO NIT for 2010-2022 and Incorrys annual basis forecast for 2023-2035. Additional information includes the corresponding Station 2 natural gas prices. Increased Station 2 connectivity to AECO-NIT is expected to lead to less seasonal volatility thereby narrowing the basis. The largest impact in the forecast occurs in 2025 when LNG Canada begins operations.
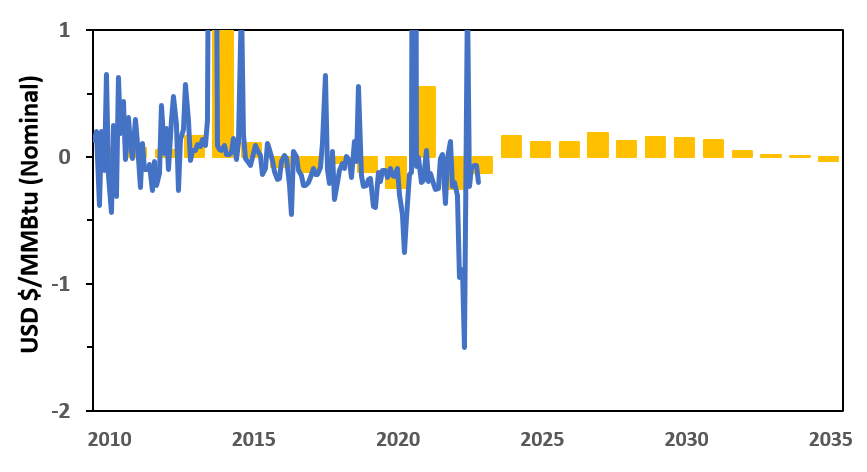
June 28, 2023
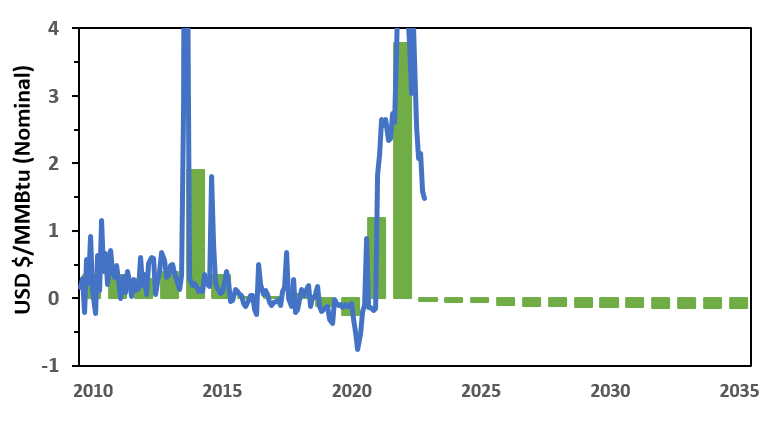
Henry Hub Price Forecast to 2035
Henry Hub monthly and annual natural gas prices (USD/MMBtu) from 2010-2022 and Incorrys annual price forecast from 2023-2035. Uncertainty in 2020 commodity markets, mainly due to Covid, saw natural gas prices drop significantly from 2019 with Henry Hub prices down by 30%. As the markets recover, Incorrys expects Henry Hub prices to generally escalate over the forecast period. However, prices increased rapidly over the past 2 years to over $6.50 in 2022 driven primarily by energy security concerns following Russia’s invasion of the Ukraine in February 2022. Incorrys expects a more balanced market in 2023 and forecasts Henry Hub prices to escalate over the forecast period.
June 28, 2023
AECO-NIT Basis and Price Forecast to 2035
AECO-NIT (Nova Inventory Transfer) actual and annual basis differentials relative to Henry Hub for 2010-2022 and Incorrys annual basis forecast for 2023-2035. Additional information includes the corresponding AECO-NIT natural gas prices. Incorrys expects the AECO basis to narrow in 2023-2025 as the Henry Hub price resets in 2023, increased pipeline capacity out of Alberta comes online, and the startup of LNG Canada in 2025. The basis differential widens over the remainder of the forecast.
June 28, 2023
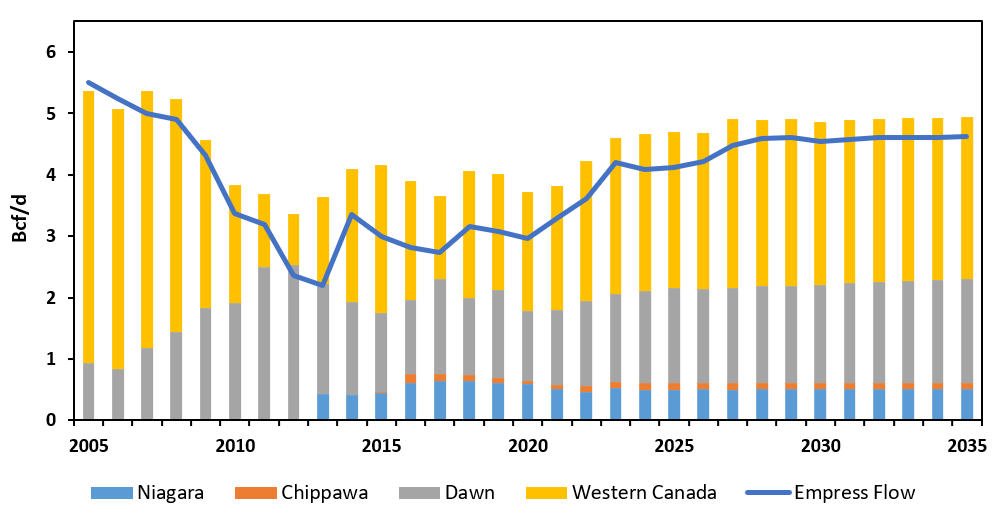
Eastern Triangle Supply Sources Forecast to 2035
Overview of supply sources required to meet Ontario’s Eastern Triangle natural gas demand to 2035, by export and import points. Additional map showing the Eastern Triangle. The composition of gas supply sources has changed over time and illustrates the impact Marcellus shale flows had on Empress flows from Western Canada through 2013. In 2035, Incorrys expects market share of supply sources to stabilize at about 50:50.
June 28, 2023
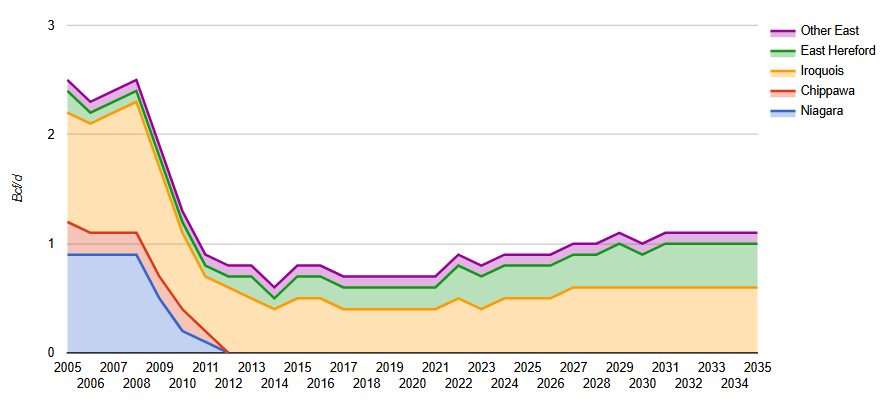
Eastern Triangle Exports Forecast to 2035
Eastern Triangle natural gas exports forecast to 2030 by export point. Additional map illustrating the Eastern Triangle region. Incorrys expects slight growth in the eastern triangle from a couple of expansion projects but do not expect any more large, long-haul pipeline capacity increases in North America.
June 27, 2023
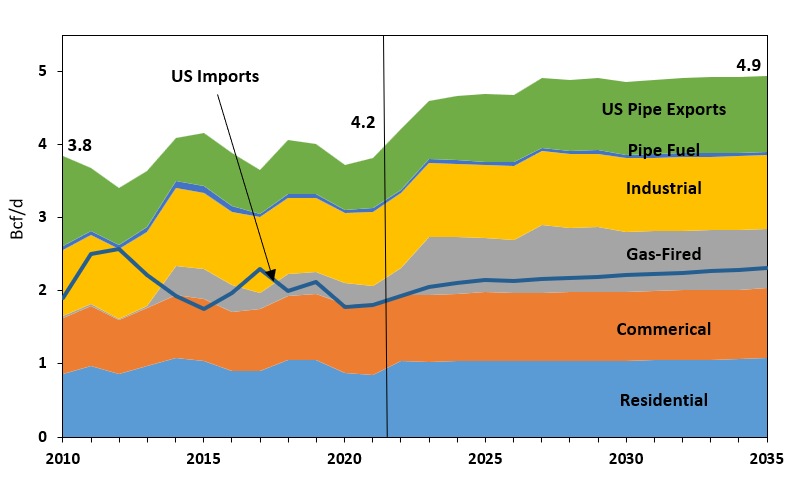
Eastern Triangle Demand Forecast to 2035
Ontario’s Eastern Triangle natural gas demand to 2035 by end-use sector including residential, commercial, electric, industrial, fuel, and US pipeline exports and imports. Additional map illustrating the Eastern Triangle region. As gas-fired demand increases, Incorrys believes US imports will remain steady and the eastern triangle market will be satisfied by increased western Canada gas supplies. Increased gas utilization in the Eastern Triangle, coupled with further depreciation of TC Mainlines prairies facilities, will put downward pressure on tolls post 2026 settlement.
June 21, 2023
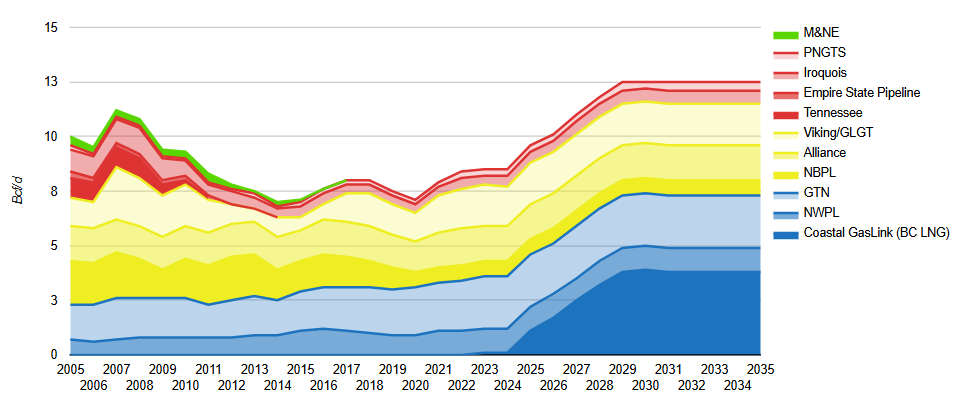
Canadian Natural Gas Exports by Pipeline Forecast to 2035
Canadian natural gas exports by pipeline, from 2005 to 2035 including a table showing the regional export market share for 2005, 2022, and 2030. West Coast export markets grow driven primarily by BC LNG exports coupled with expansion of Gas Transmission North (GTN). On the East Coast, increased competition with Marcellus supply has pushed out Canadian gas exports from northeast markets although lack of new pipeline build has allowed exports to remain strong into New England.
June 21, 2023
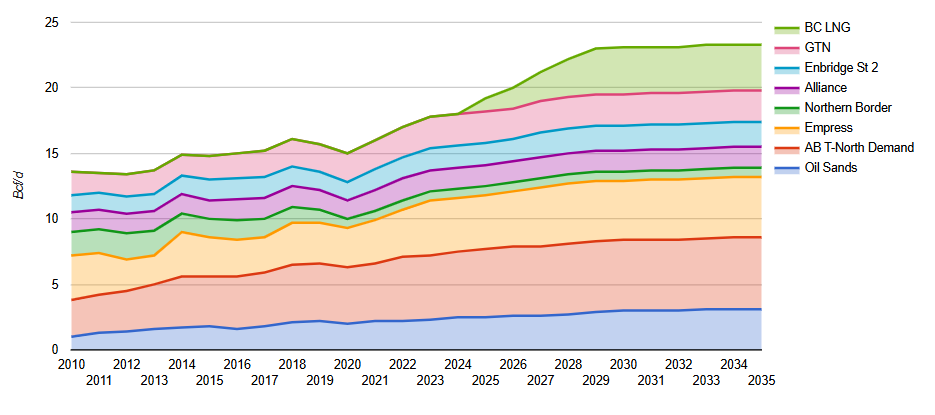
Alberta and Northeast BC Natural Gas Production Allocation Forecast to 2035
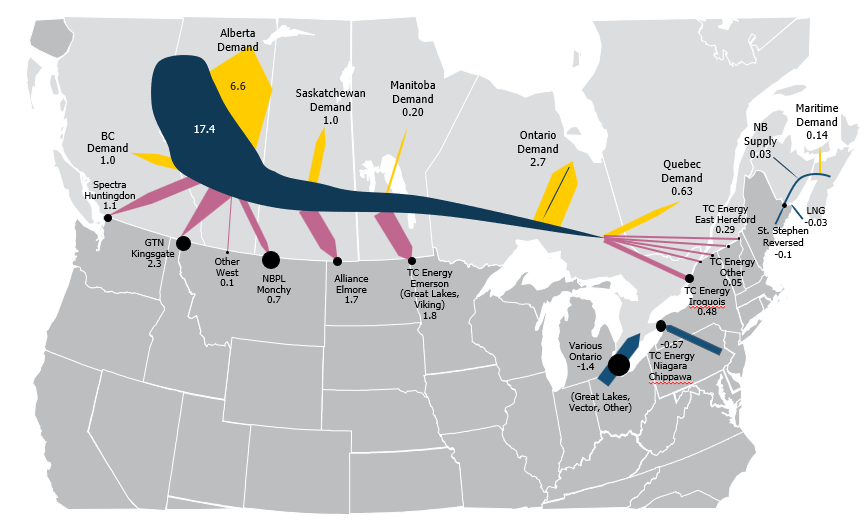
Forecast to 2035 of the allocation of supply for both intra-Alberta and ex-Alberta (via pipeline) demand. Includes a schematic of the Western Canadian pipeline system. Supply growth is driven largely by the demand from liquefied natural gas (LNG) exports from the West Coast beginning in 2025.
November 3, 2021
World LNG Liquefaction Capacity Growth
Forecast of world liquefied natural gas (LNG) liquefaction capacity growth through 2025, in MTPA (million tons per annum). Early last year, liquefaction projects totaling 900 MTPA were proposed, primarily in the US and Canada, although most will be uneconomical and not be built.
August 18, 2021
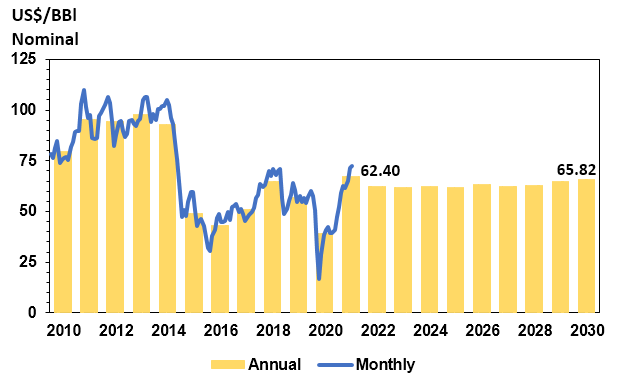
West Texas Intermediate (WTI) Price Forecast to 2030
West Texas intermediate (WTI) monthly and annual crude oil prices since 2010 and Incorrys annual price forecast to 2030. Uncertainty in 2020 commodity markets, mainly due to Covid, also saw crude oil prices drop significantly from 2019 with WTI down about 50%. Incorrys expects the West Texas Intermediate (WTI) price to increase marginally through 2030.
August 18, 2021
Western Canada Select (WCS) Price Forecast to 2030
Western Canada Select (WCS) actual and annual crude oil prices since 2010 and Incorrys annual price forecast to 2030. Additional information includes the corresponding basis differentials to West Texas Intermediate (WTI) price. WCS 2020 prices were down 60% year-over-year, again, primarily due to the impact of Covid. Incorrys expects the Western Canada Select price to increase slowly through to 2030.
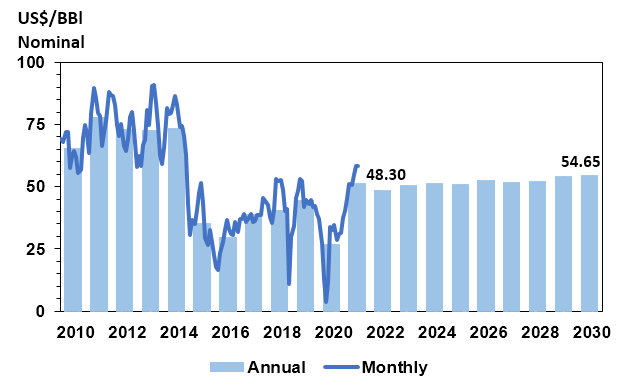
August 15, 2021
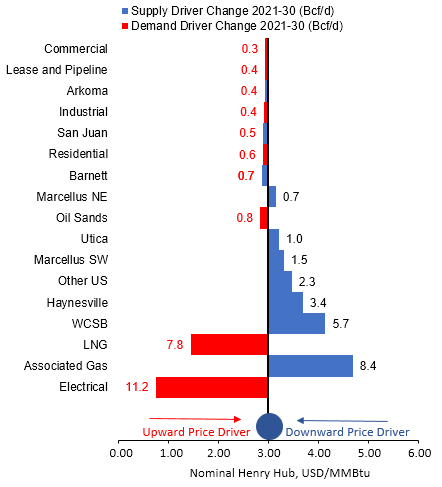
Henry Hub Natural Gas Influences (2021-2030)
How changes in various supply and demand fundamental drivers impact Henry Hub natural gas prices over the 2021-30 time period. The largest contributors are natural gas for the electric generation sector, liquefied natural gas (LNG) exports, and supply growth.
July 5, 2021
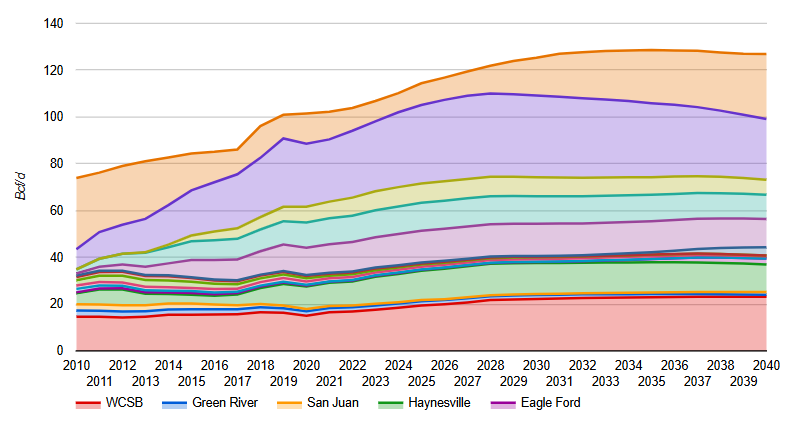
North American Dry Natural Gas Production Forecast
Forecast of US and Canadian dry gas production, by area, to 2040. US production and development is primarily focused in two regions: Appalachia (Marcellus and Utica) and Haynesville while Canada’s is focused primarily in Alberta. Supply growth is driven by forecasted growth in demand from the power generation sector and LNG exports.
July 5, 2021
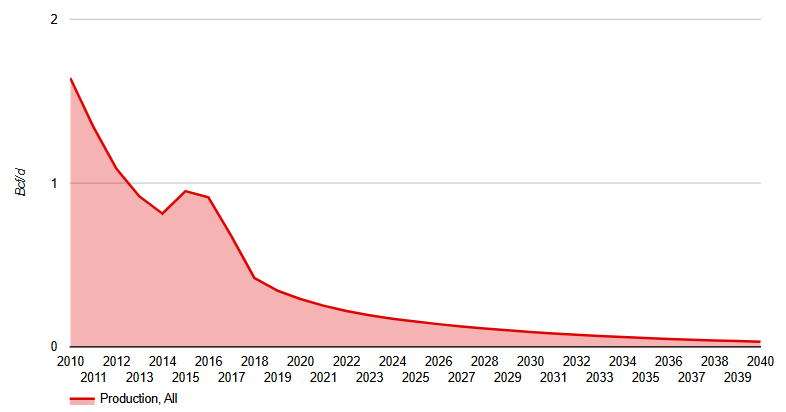
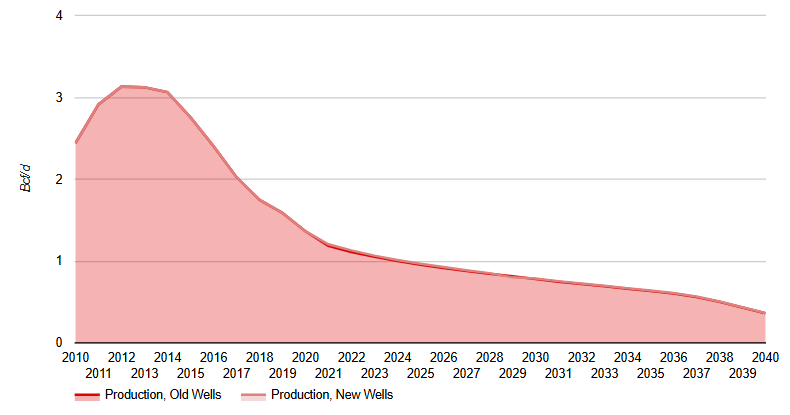
Barnett Raw Natural Gas Production
Forecast to 2040 of the shale gas production from Barnett (located north of Dallas and Ft Worth Texas). Additional drilling map of the area. Barnett was the first basin to prove horizontal drilling and multistage fracking for shale gas. Barnett consists of a gas area in the south portion of the basin and oil and condensate area in the north portion.
July 5, 2021
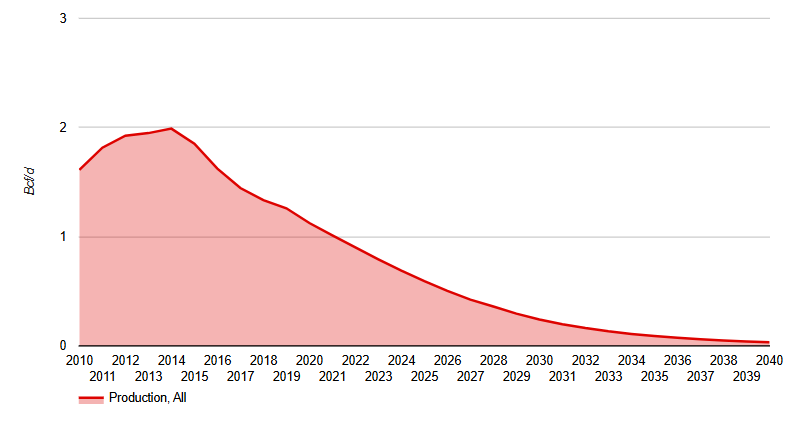
Gulf of Mexico Offshore Natural Gas Production
Forecast to 2040 of the natural gas production from the offshore Gulf of Mexico (located offshore Texas and Louisiana). Additional drilling map of the area. Current natural gas focused drilling in the Gulf of Mexico is very limited due to the high cost relative to other basins. Incorrys does not expect Gulf of Mexico gas production to recover during the forecast period and is negligible by 2040.
July 2, 2021
Arkoma Raw Natural Gas Production
Forecast to 2040 of the raw natural gas production from Arkoma (located in Arkansas and Oklahoma). Additional charts show corresponding initial productivity (IP), well count, rig count, estimated ultimate recovery (EUR) and a drilling map of the area. Arkoma production was focused on Fayetteville Shale and Woodford Shale, however, both shales are now mature and Incorrys does not expect any further development after 2030.
June 18, 2021
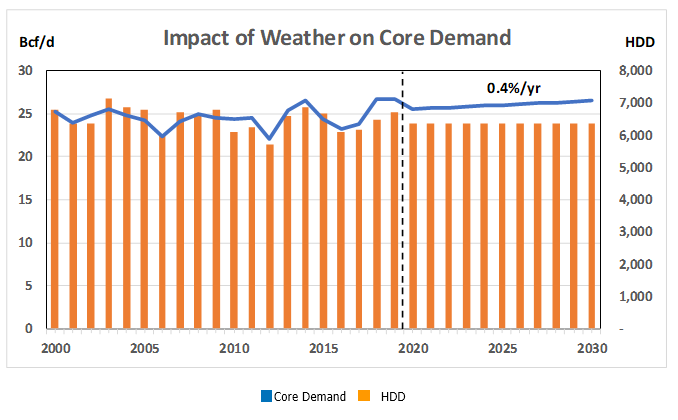
Core Demand for North American Natural Gas
Historical North American natural gas demand for the core sectors (residential and commercial) which mainly uses natural gas for winter heating loads. As such, increases and decreases in core sector demand is highly correlated to Heating Degree Days (HDD). The core sector customer count drives normalized demand growth.
June 18, 2021
North American Industrial Demand for Natural Gas
North American industrial demand forecast for natural gas to 2030, by region. Industrial demand is the most price sensitive of all of the demand sectors. During the 2000’s, price increases caused overall industrial demand to decline. However, with the rapid production growth in low cost shale gas, lost industrial demand began to recover.
June 14, 2021
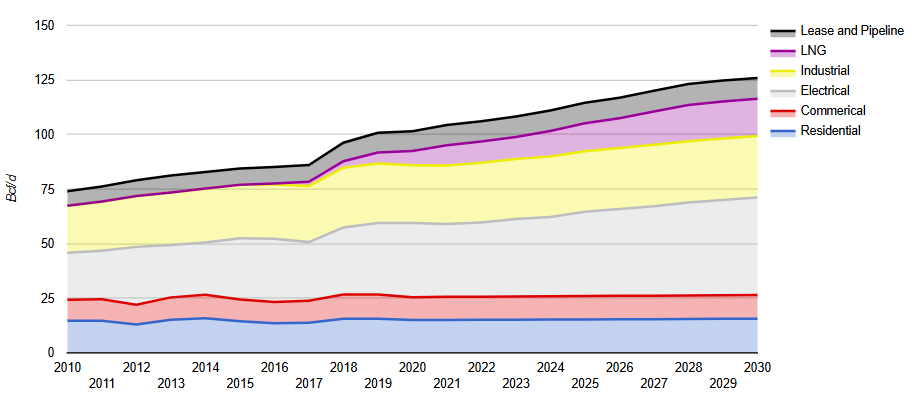
North American Gas Demand to 2030
Forecast to 2030 of natural gas demand in North America by sector, including residential, commercial, power generation, industrial, LNG exports, and fuel. The largest growth drivers for natural gas are liquefied natural gas (LNG) exports and increased use for power generation as the industry retires and closes coal-fired plants.
June 14, 2021
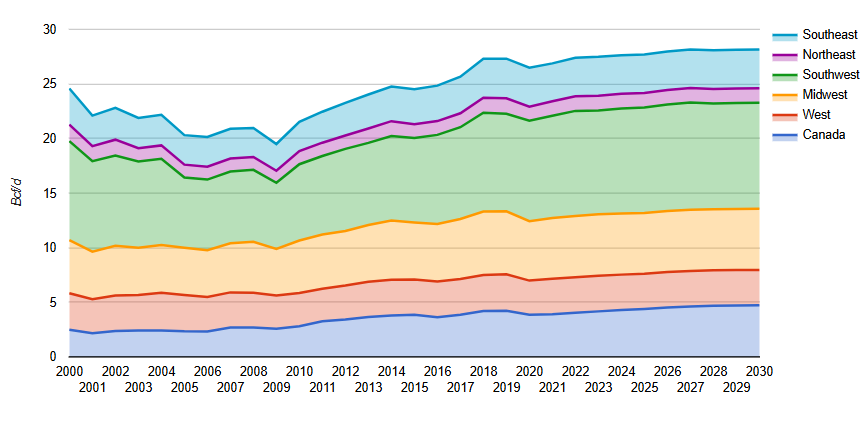
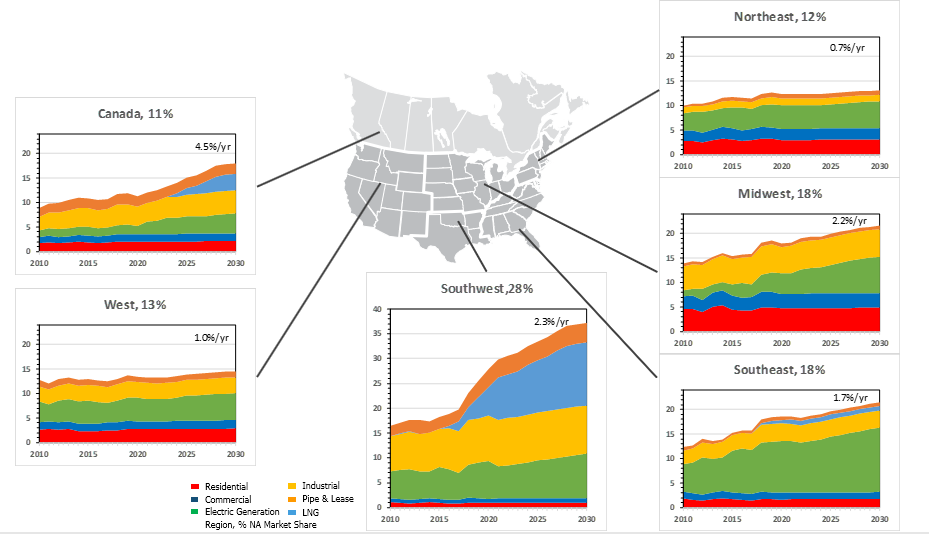
North American Gas Demand by Region
Breakdown of North American gas demand by region and end-use sector to 2030. Regionally, the US Southwest is expected to lead natural gas demand growth due to strong LNG export development. Declining coal-fired capacity drives growth in gas use, especially in the Midwest and Southeast regions.
November 26, 2020
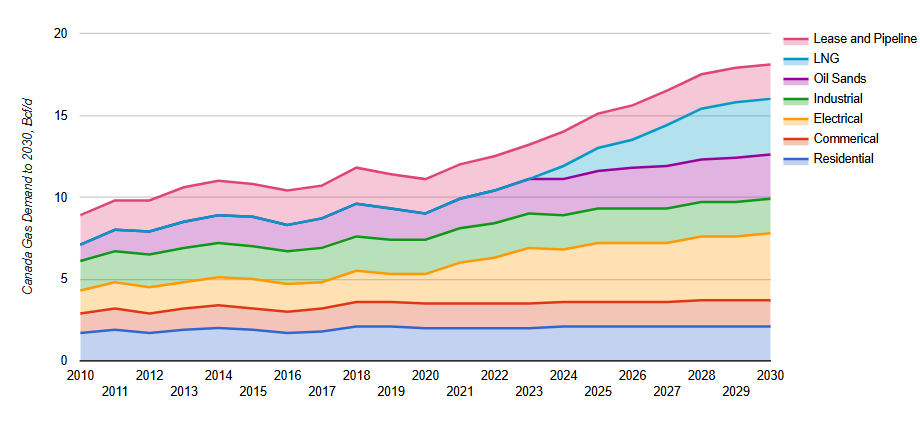
Canadian Natural Gas Demand To 2030
Total Canadian natural gas demand through 2030 by end-use sector including, residential, commercial, electrical, industrial, Oil Sands, Liquefied natural Gas (LNG), and fuel. Growth is driven by the power generation sector, where natural gas use replaces coal, and LNG exports.
November 26, 2020
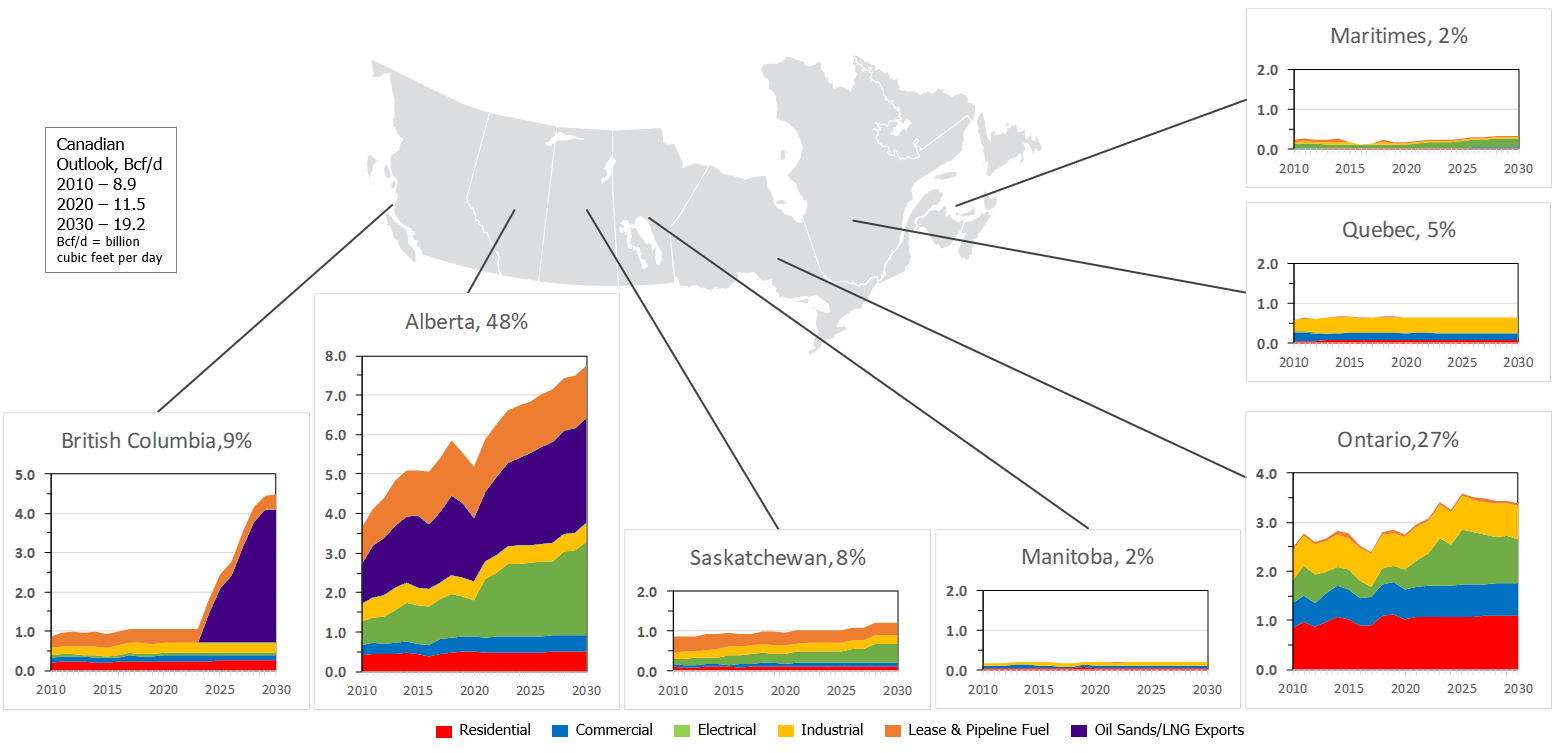
Canadian Provincial Natural Gas Demand Outlook
Forecast to 2030 of total Canadian natural gas demand by province and end-use sector including residential, commercial, electric, industrial, fuel, and Oil Sands & liquefied natural gas (LNG) exports (Bcf/d). Demand growth is driven by power generation (natural gas replacing coal as a fuel), LNG exports, and Alberta oil sands.