

North American Natural Gas Demand
North American Gas Demand to 2035

November 07, 2025
Forecast to 2035 of natural gas demand in North America by sector, including residential, commercial, power generation, industrial, LNG exports, and fuel. The largest growth drivers for natural gas are liquefied natural gas (LNG) exports and increased use for power generation as the industry retires and closes coal-fired plants.
North American Gas Demand by Region
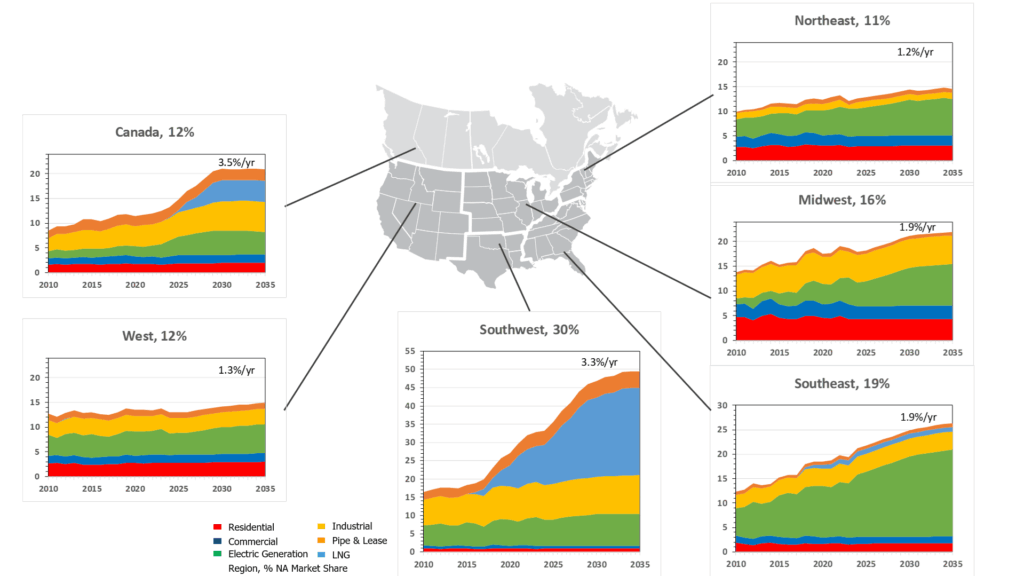
November 07, 2025
Breakdown of North American gas demand by region and end-use sector to 2035. Regionally, the US Southwest is expected to lead natural gas demand growth due to strong LNG export development. Declining coal-fired capacity drives growth in gas use, especially in the Midwest and Southeast regions.
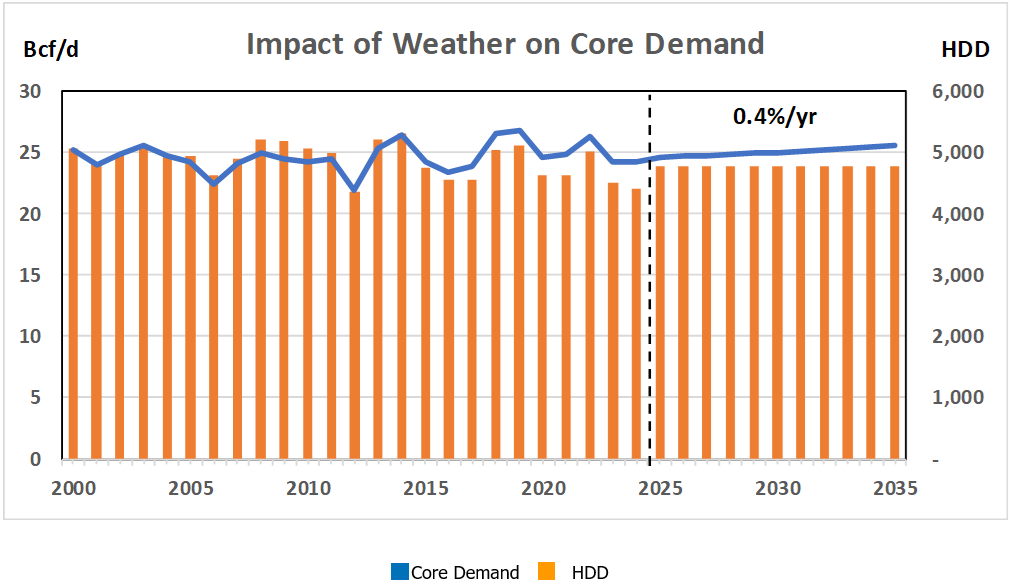
Core Demand for North American Natural Gas
November 04, 2025
Historical North American natural gas demand for the core sectors (residential and commercial) which mainly uses natural gas for winter heating loads. As such, increases and decreases in core sector demand is highly correlated to Heating Degree Days (HDD). The core sector customer count drives normalized demand growth.
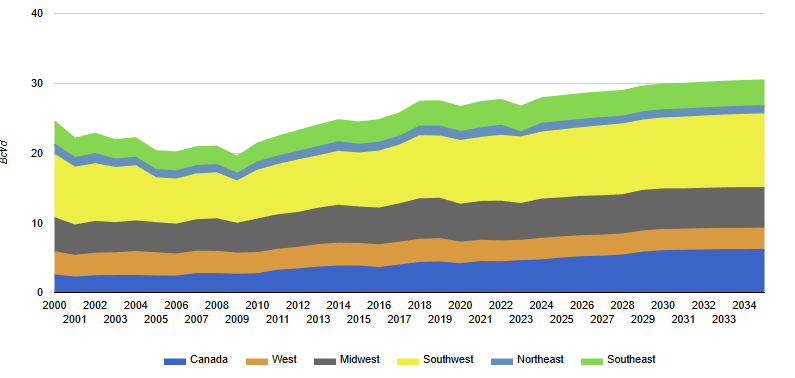
North American Industrial Demand for Natural Gas
November 07, 2025
North American industrial demand forecast for natural gas to 2035, by region. Industrial demand is the most price sensitive of all of the demand sectors. During the 2000’s, price increases caused overall industrial demand to decline. However, with the rapid production growth in low cost shale gas, lost industrial demand began to recover.
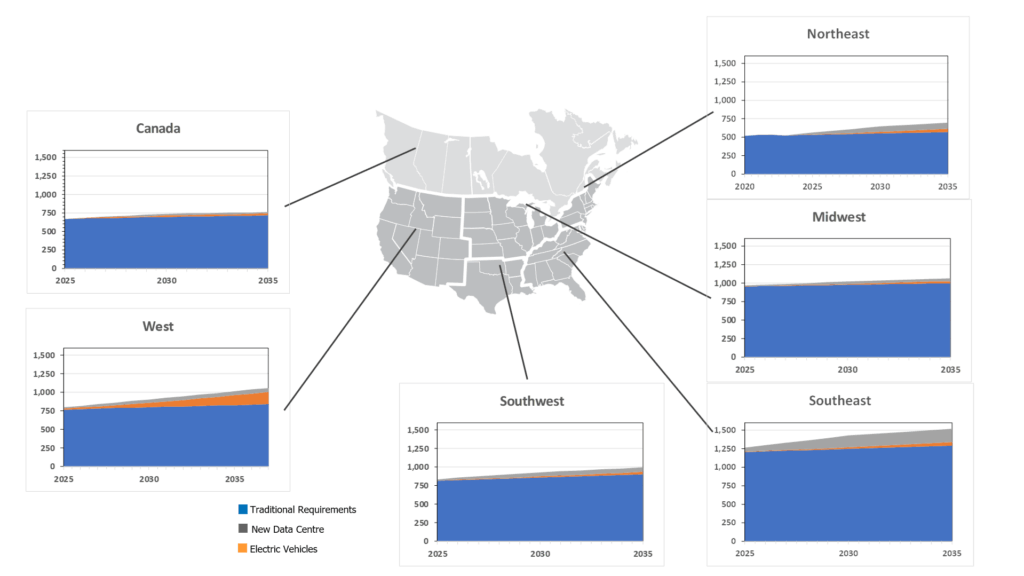
E-Vehicle and Data Centre Driving Power Demand Growth
November 04, 2025
Charts illustrates electric vehicles and data centers driving power demand growth (TWh) to 2035.
Canadian Natural Gas Demand
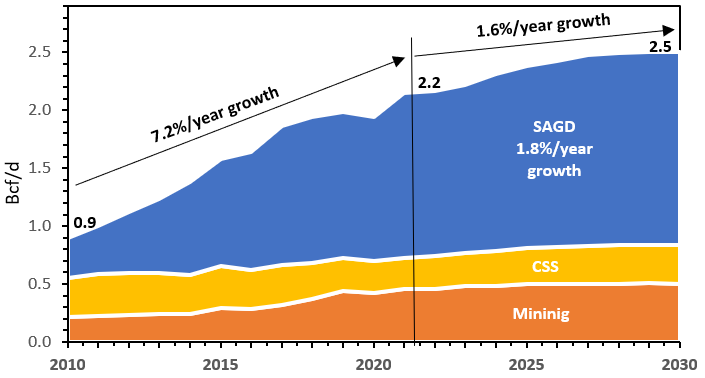
Natural Gas Requirements for Oil Sands Forecast to 2030
July 11, 2024
Natural gas demand forecast to 2030 for western Canada’s oil sands mining and in situ (Cyclic Steam Stimulation (CSS) and Steam Assisted Gravity Drainage (SAGD)) requirements. Natural gas requirements for Canadian oil sands grew at an average annual rate of 7.2% from 2010 through 2023 from under 1 Bcf/d to 2.2 Bcf/d. Incorrys is forecasting annual growth in oil sands natural gas demand to slow to 1.6% from 2023 to 2030 as the rate of in situ slows.
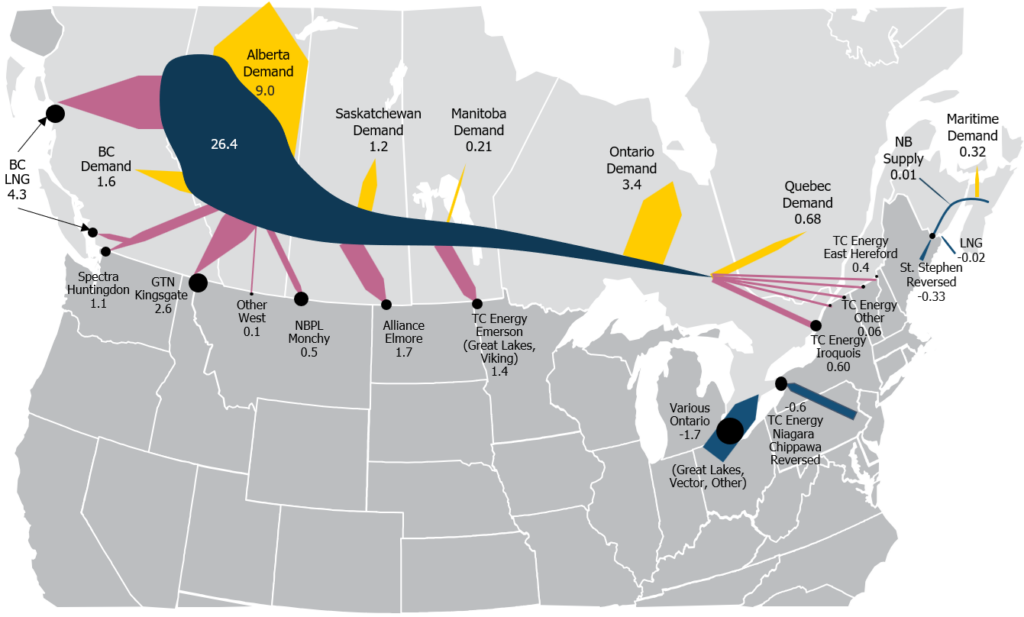
Canadian Natural Gas Supply-Demand Balance Forecast to 2035
2035
February 09, 2026
Overview of the Canadian natural gas supply-demand balance for 2010, 2020, 2022, 2025 and 2030, showing the receipt and delivery volumes of natural gas by province and export/import points..
The biggest changes in the Canadian supply-demand balance between 2010 and 2035 is competition with Marcellus shale gas limiting western Canadian supply into the eastern region and increased Alberta supply for liquefied natural gas exports from the west coast.
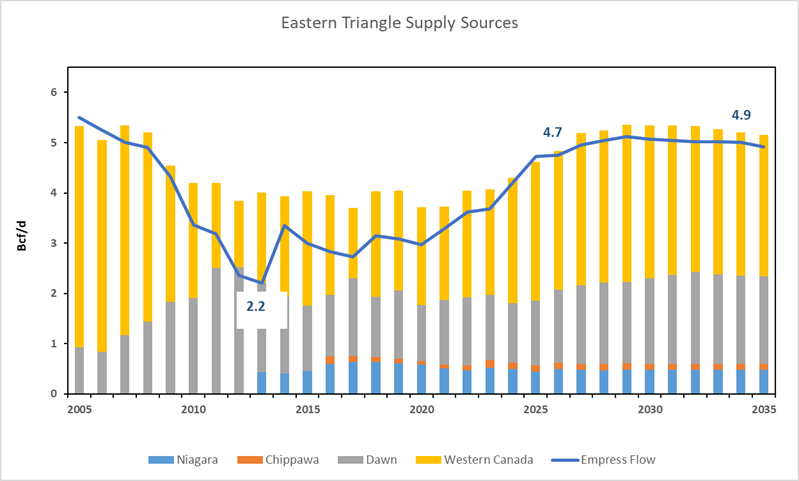
Eastern Triangle Supply Sources Forecast to 2035
February 09, 2026
Overview of supply sources required to meet Ontario’s Eastern Triangle natural gas demand to 2035, by export and import points. Additional map showing the Eastern Triangle. The composition of gas supply sources has changed over time and illustrates the impact Marcellus shale flows had on Empress flows from Western Canada through 2013. In 2035, Incorrys expects market share of supply sources to stabilize at 50:50 with commitments to long-term pipeline capacity and increased power demand resulting from shuttered Ontario Nuclear capacity.
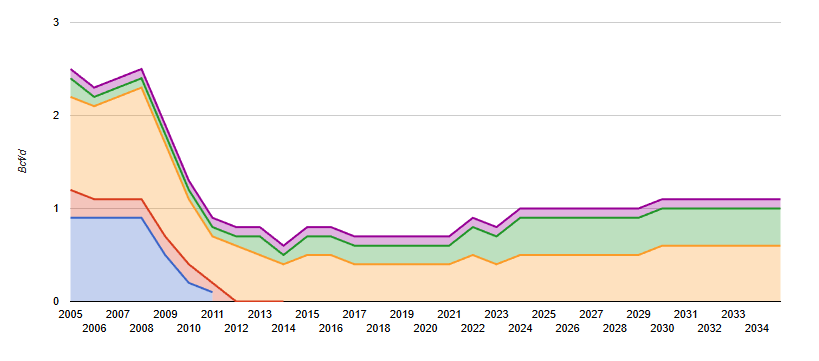
Eastern Triangle Exports Forecast to 2035
February 09, 2026
Eastern Triangle natural gas exports forecast to 2035 by export point. Additional map illustrating the Eastern Triangle region.
Eastern Triangle Demand Forecast to 2035
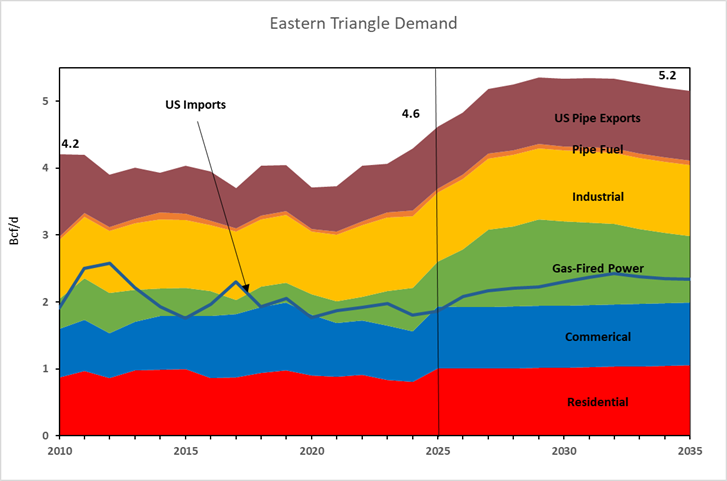
February 09, 2026
Ontario’s Eastern Triangle natural gas demand to 2035 by end-use sector including residential, commercial, electric, industrial, fuel, and US pipeline exports and imports. Additional map illustrating the Eastern Triangle region.
Canadian Natural Gas Exports by Pipeline Forecast to 2035
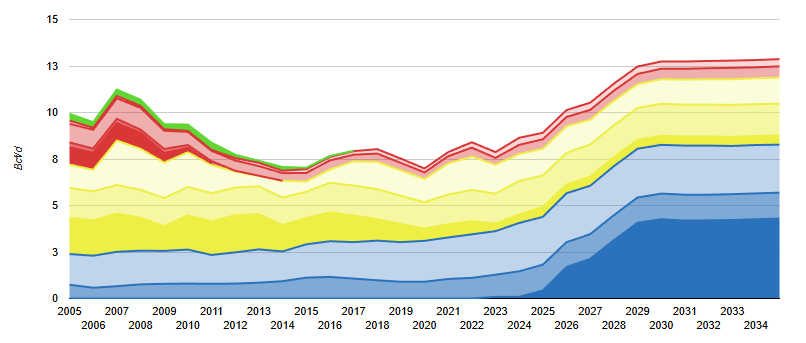
February 09, 2026
Canadian natural gas exports by pipeline, from 2005 to 2035 including a table showing the regional export market share for 2005, 2025 and 2030. Increased competition from Marcellus supply has pushed out Canadian gas from Northeast markets – 27% of export market share in 2005, now 10%.
Alberta and Northeast BC Natural Gas Production Allocation Forecast to 2035
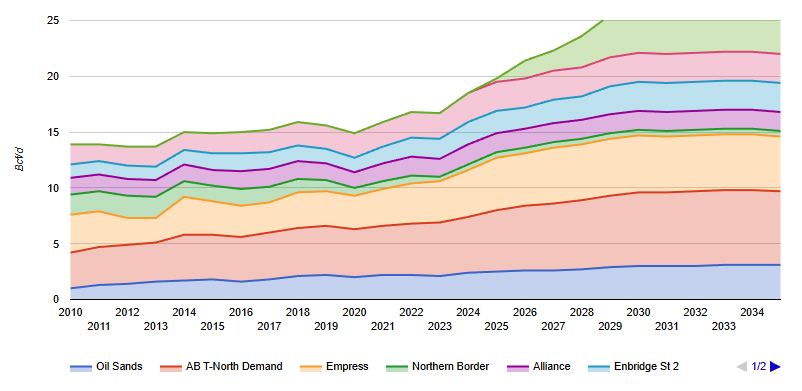
February 09, 2026
Forecast to 2035 of the allocation of supply for both intra-Alberta and ex-Alberta (via pipeline) demand. Includes a schematic of the Western Canadian pipeline system. Supply growth is driven largely by the demand from liquefied natural gas (LNG) exports from the West Coast beginning in 2025.
Canadian Natural Gas Demand To 2030
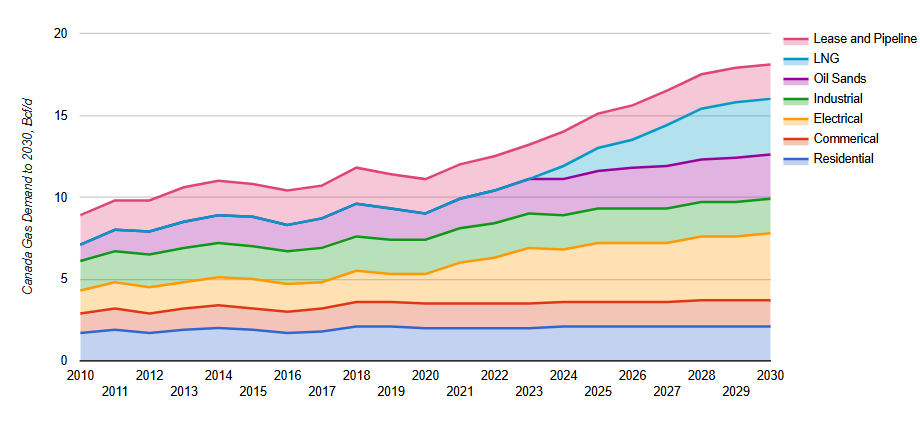
November 26, 2020
Total Canadian natural gas demand through 2030 by end-use sector including, residential, commercial, electrical, industrial, Oil Sands, Liquefied natural Gas (LNG), and fuel. Growth is driven by the power generation sector, where natural gas use replaces coal, and LNG exports.
Canadian Provincial Natural Gas Demand Outlook
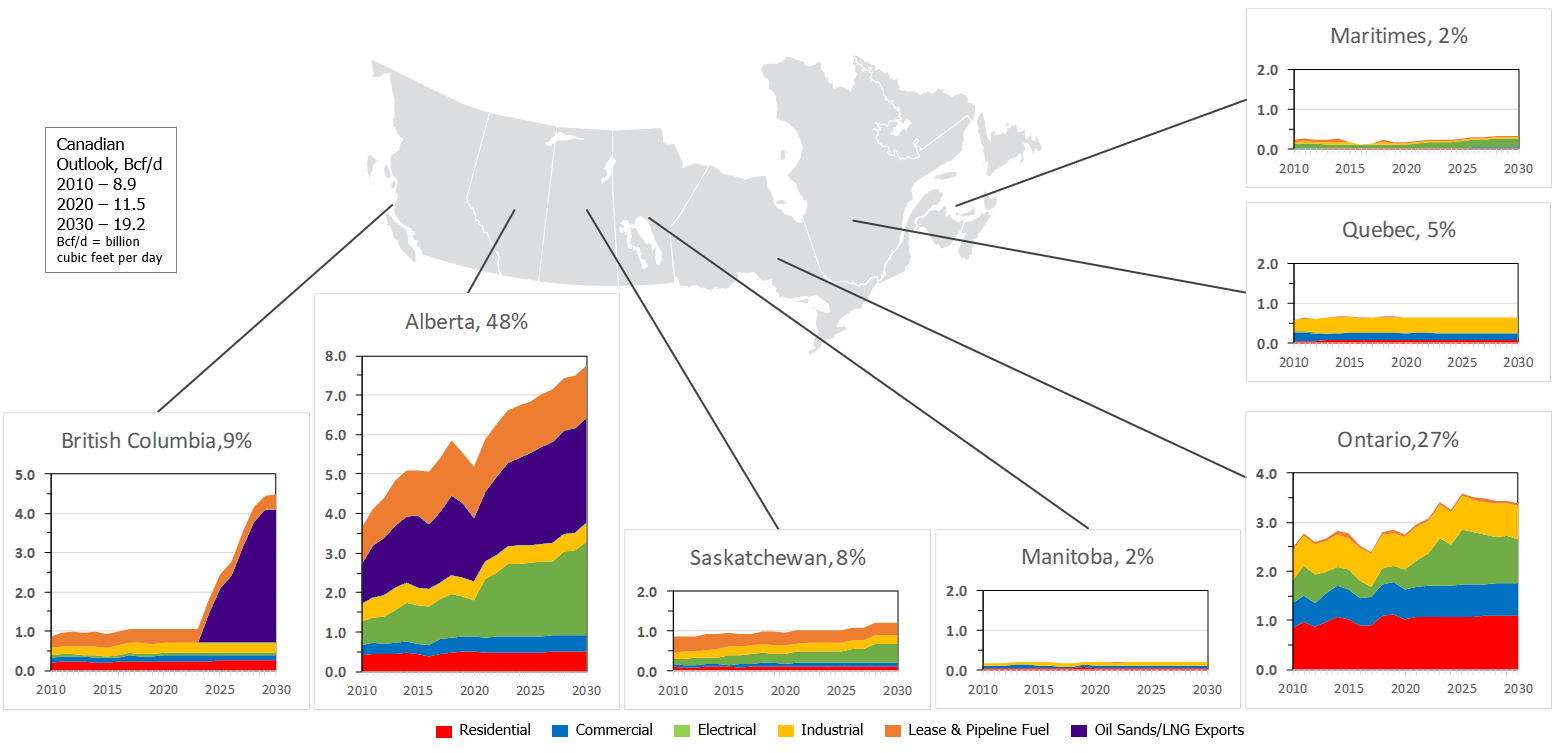
November 26, 2020
Forecast to 2030 of total Canadian natural gas demand by province and end-use sector including residential, commercial, electric, industrial, fuel, and Oil Sands & liquefied natural gas (LNG) exports (Bcf/d). Demand growth is driven by power generation (natural gas replacing coal as a fuel), LNG exports, and Alberta oil sands.
Core Demand For Natural Gas In Canada
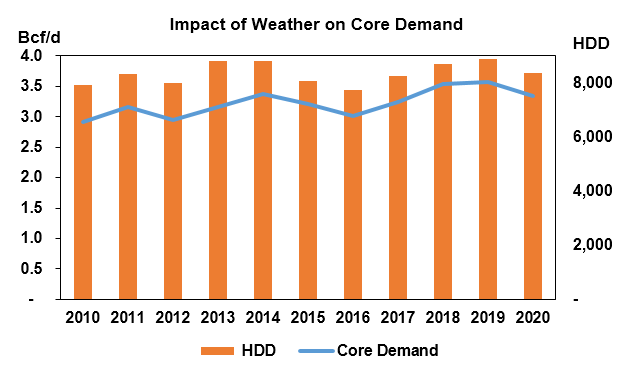
November 26, 2020
Historical Canadian natural gas demand for the core sectors (residential and commercial) which mainly use natural gas for winter heating loads. As such, increases and decreases in core sector demand is highly correlated to Heating Degree Days (HDD). The core sector customer count drives normalized demand growth.
Industrial Demand for Canadian Natural Gas
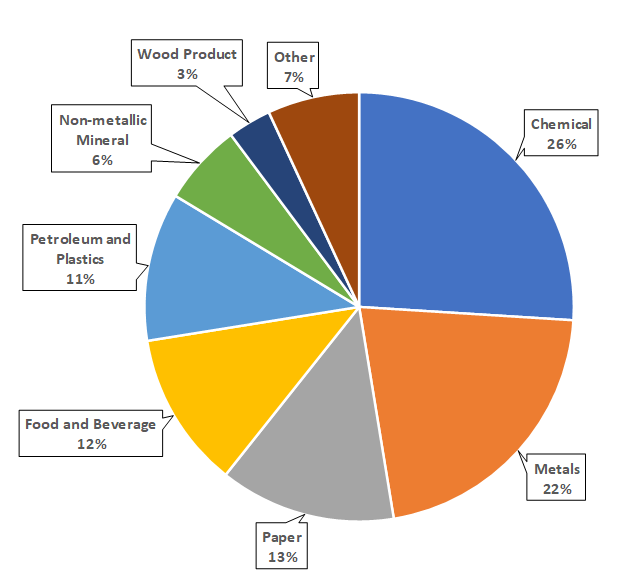
November 26, 2020
Canadian natural gas industrial demand by sub-sector including the five most gas-intensive sub-sectors: chemical manufacturing (fertilizer and methanol), fabricated and primary metals, paper, food and beverage, and petroleum and plastics. Chemical manufacturing accounts for just over 25% of the total and tends to be the gas-intensive of the industrial sub-sector. Fabricated and primary metals account for just under 25%.