

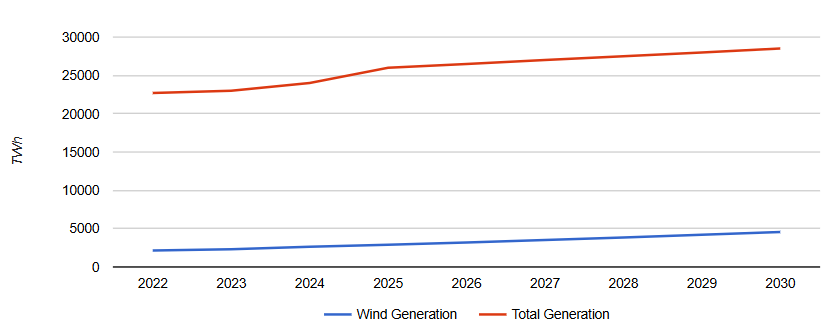
Wind Power Generation Forecast 2022-2030
June 19, 2024
Global wind power generation forecast from 2022-2030 in TWh. Additional chart showing the 2030 market share by country. Global electricity demand declined slightly in 2021 due to the Covid pandemic and has rebounded slowly into 2023. The growth is expected to accelerate going forward and will be met more by renewables, including wind. Incorrys forecasts wind generation to double from 2150 TWh in 2022 to over 4500 TWh in 2030 and will represent 16% of global electric generation.
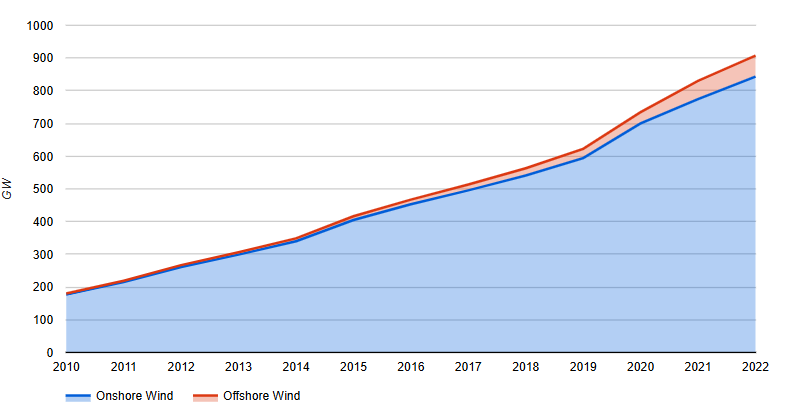
Wind Power Generation Capacity 2010-2022
July 31, 2023
Global wind power generation capacity (GW) for 2010-2022 broken down by onshore and offshore. Additional chart showing 2022 market share by region and illustrative map showing historical by country. Capacity grew almost 80 GW in 2022 to 910 GW, the lowest build over the past 3 years (112 GW in 2020 and 95 GW in 2021), although it still ranks as the 3rd highest year. China accounts for over 40% (390 GW) of the total installed wind capacity.
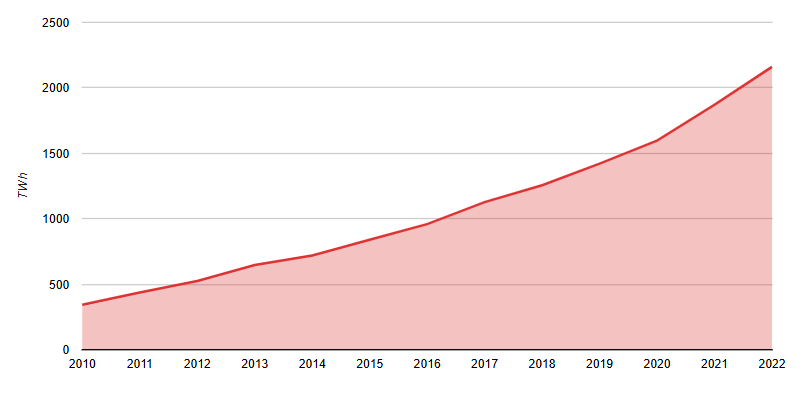
Wind Power Generation 2010-2022
July 31, 2023
Global power generation from wind (TWh) from 2010-2022. Additional chart showing the 2023 market share and illustrative map showing historical by country. Global wind power generated over 2100 TWh of electricity in 2022, up 6-fold from just 350 TWh in 2010. China represents almost 40% of the total global wind generation with 825 TWh.
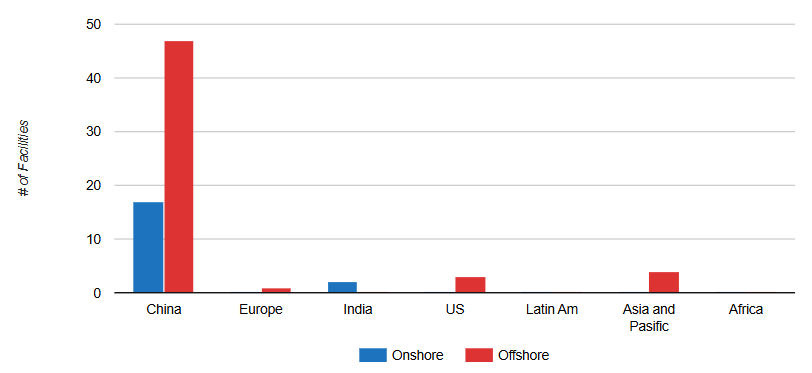
Nacelle Assembly Facilities
August 1, 2023
Global nacelle (wind turbine housing on top of the tower that contains all the generating components) assembly facilities by region and onshore vs offshore. Additional charts showing facilities under construction/announced vs. current operational total. There are currently about 75 nacelle assembly facilities currently under construction or in the planning stage – 55 of which are offshore and 20 onshore. China accounts for 85% of the total with 65 – about 50 offshore and 15 onshore.
Wind Power Annual Capacity Additions 2022-2030
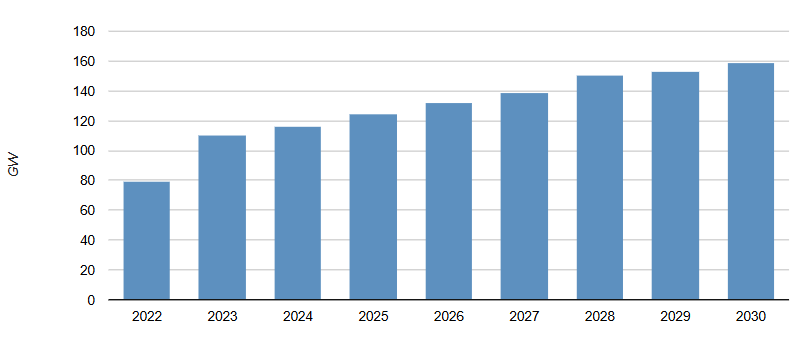
August 2, 2023
Annual global wind generation capacity additions (GW) forecast to 2030. Additional charts broken down by region (North America, Europe, and China) and further split between onshore and offshore. Global additions increase from about 80 GW in 2022 to almost 160 GW in 2030. It is expected that this will be enough to cover increasing global demand however, some regions will face capacity issues in coming years.
Wind Power Capacity Forecast 2022-2030
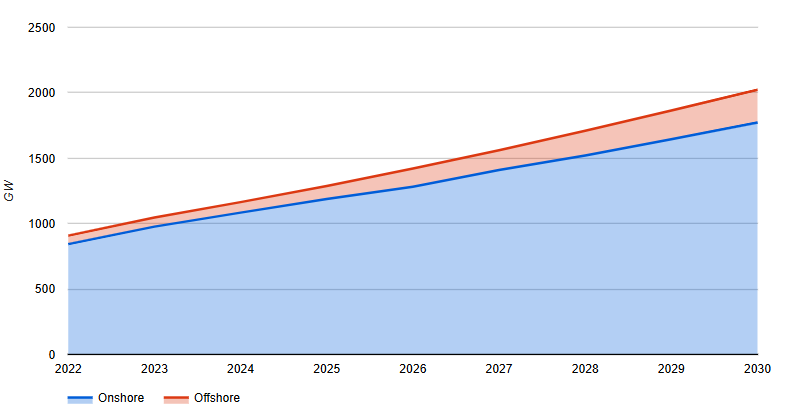
June 19, 2024
Global wind power capacity forecast (GW) from 2022-2030 split between onshore and offshore generation. Additional charts include the total capacity forecast by country and 2030 global market share. Incorrys expects global wind power capacity will break the 1 TW mark sometime in 2023 and will eclipse the 2 TW range by 2030. China will account for about 50% of the total global wind generating capacity.
Wind: Cost of Components
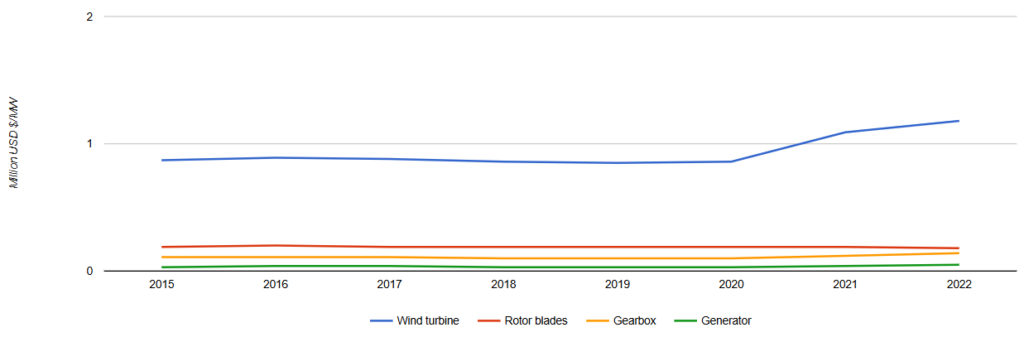
August 14, 2023
The cost of components for 1 MW of wind power capacity (Million USD $/MW) from 2015 through 2022. The average cost of building 1 MW of wind generation capacity has increased almost 40% since 2020 from about USD$850,000 to $1,200,000. By primary component, the gearbox and generator costs are up 40% and 70% respectively while the cost of the rotor blades has declined slightly.