

November 07, 2025
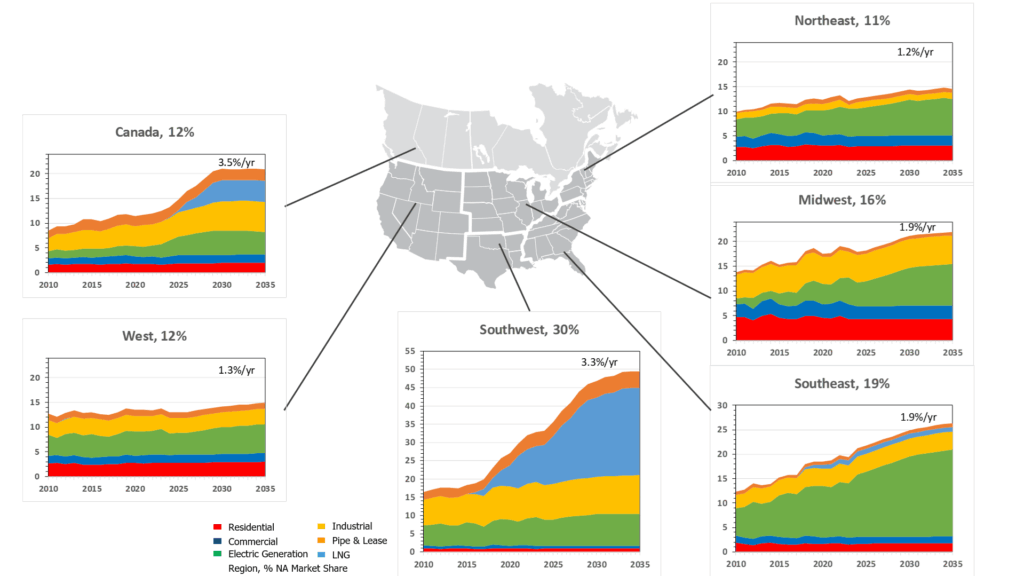
The chart shows a breakdown of North American gas demand by region to 2035. US Southwest is expected to lead regional natural gas growth. Growth is driven by recently completed and under-construction LNG liquefaction projects. Industrial demand is expected to increase 0.8 Bcf/d by 2035 as investments in refining and petrochemical sectors come online. Declining coal-fired power capacity drives growth in gas-fired generation, especially in the Midwest and Southeast regions. AI Datacenter development also favours the Southeast region. Strong electric vehicle adoption in the West region, drives a slight increase in gas-fired generation.
See also:
North American Gas Demand
Core Demand for North American Natural Gas
North American Industrial Demand for Natural Gas