

World LNG
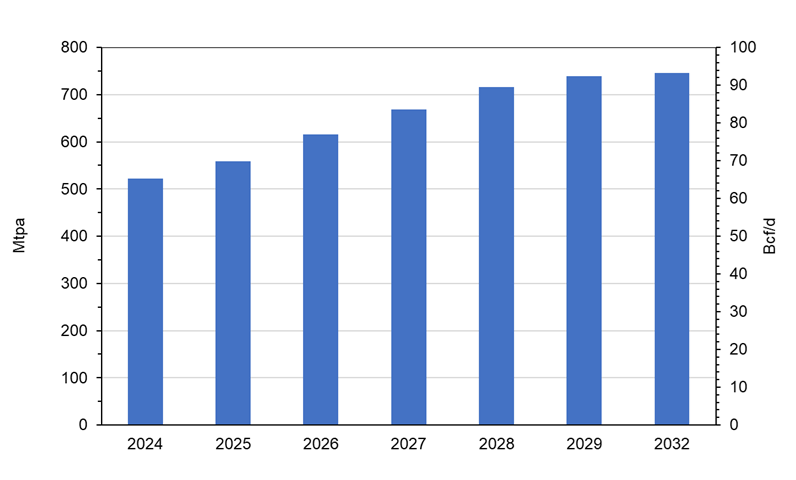
Global Liquefaction Capacity Growth 2024-2032
November 12, 2025
Global LNG liquefaction capacity growth from 2024-2032 in mtpa and Bcf/d equivalent. Additional charts showing 2024 LNG exports by country and 2032 liquefaction capacity by country.
In 2024, there were 22 countries exporting LNG led by the US, Australia, Qatar, Russia and Malaysia. Combined, these top exporters accounted for 75% of the world total. The largest exporting region continued to be Asia Pacific with a total of over 139 mtpa (~18.5 Bcf/d) in 2024.
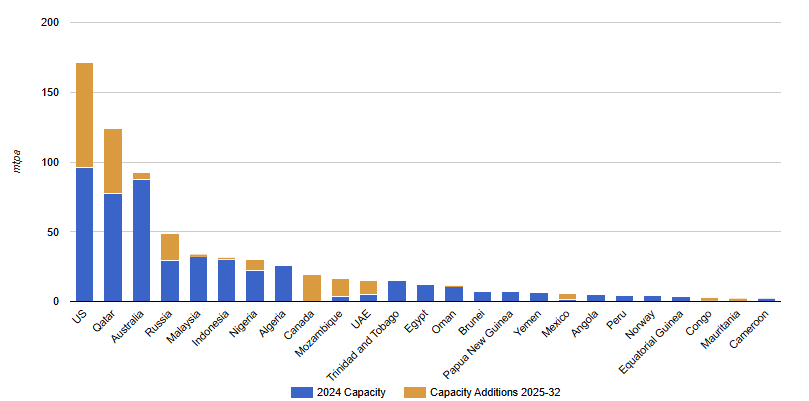
Liquefaction Capacity by Country Forecast to 2032
November 12, 2025
Global LNG liquefaction capacity stood at 488 mtpa (~65 Bcf/d) by 2024. In 2024, projects totaling 210 mtpa (~28 Bcf/d) are being developed globally. By 2032, global capacity is expected to reach over 699 mtpa, equivalent to ~93 Bcf/d.
LNG Exports by Country 2024
November 12, 2025
In 2024, there were 22 countries exporting LNG led by the US, Australia, Qatar, Russia and Malaysia. Combined, these top exporters accounted for 75% of the world total. The largest exporting region continued to be Asia Pacific with a total of over 139 mtpa (~18.5 Bcf/d) in 2024, a 10 mtpa increase compared to 2023.
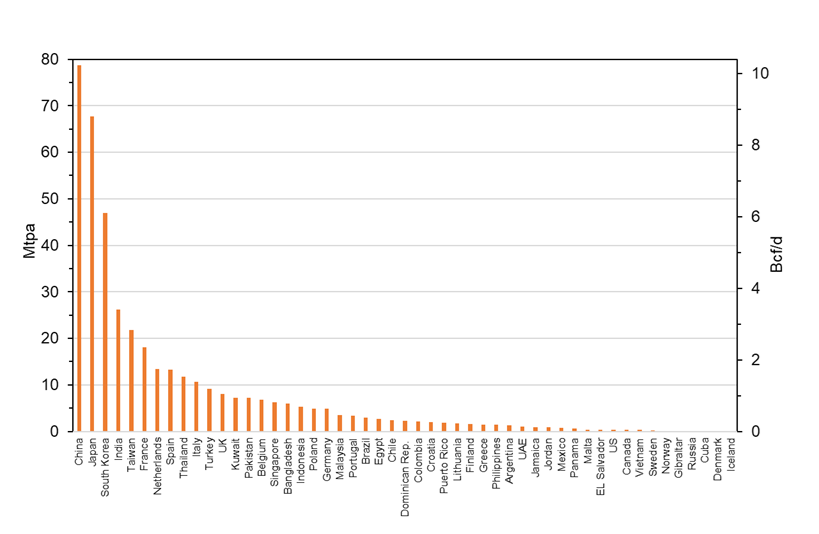
LNG Imports by Country 2024
November 13, 2025
Global LNG trade reached a new record of over 411 mtpa (~55 Bcf/d) in 2024. In total, there are now 48 (chart shows the largest importers) countries importing LNG worldwide. The top 7 countries accounted for almost 66% of total LNG import volumes in 2024.
LNG Regasification by Country 2024
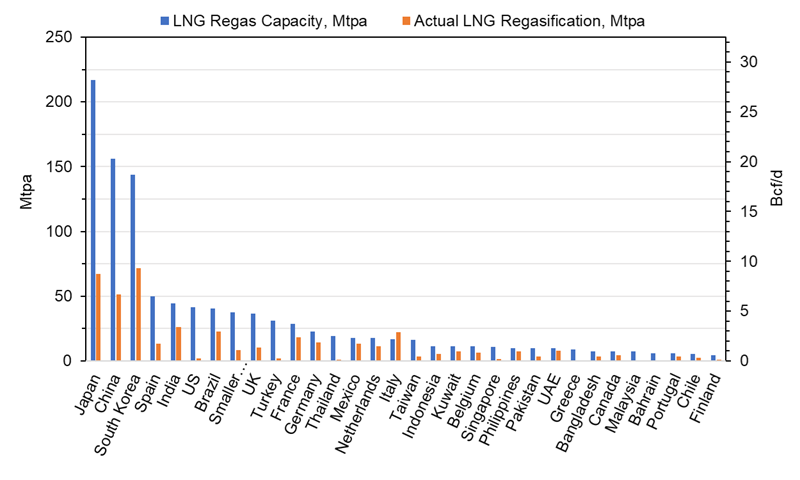
November 13, 2025
Global regasification capacity grew by 58 mtpa (7.7 Bcf/d) to 1064 mtpa (141.9 Bcf/d) across 32 markets. Japan has the largest regasification capacity at 217 mtpa (~29 Bcf/d), followed by China at 156 mtpa (~20 Bcf/d) and South Korea at 143 mtpa (~19 Bcf/d). Combined, these top 3 countries account for almost half of global regasification capacity.
LNG Shipping Fleet and Charter Rates
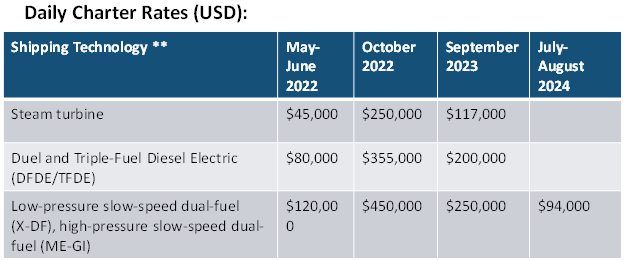
November 13, 2025
The global LNG shipping fleet increased by 5% in 2023 with the delivery of 32 new vessels and grew by a further 11 vessels in the first 2 months of 2024 to ~ 701 active vessels; including 47 operational Floating Storage and Regasification Units (FSRUs) and 10 Floating Storage Unit (FSUs).
LNG Export & Import Shipping Routes
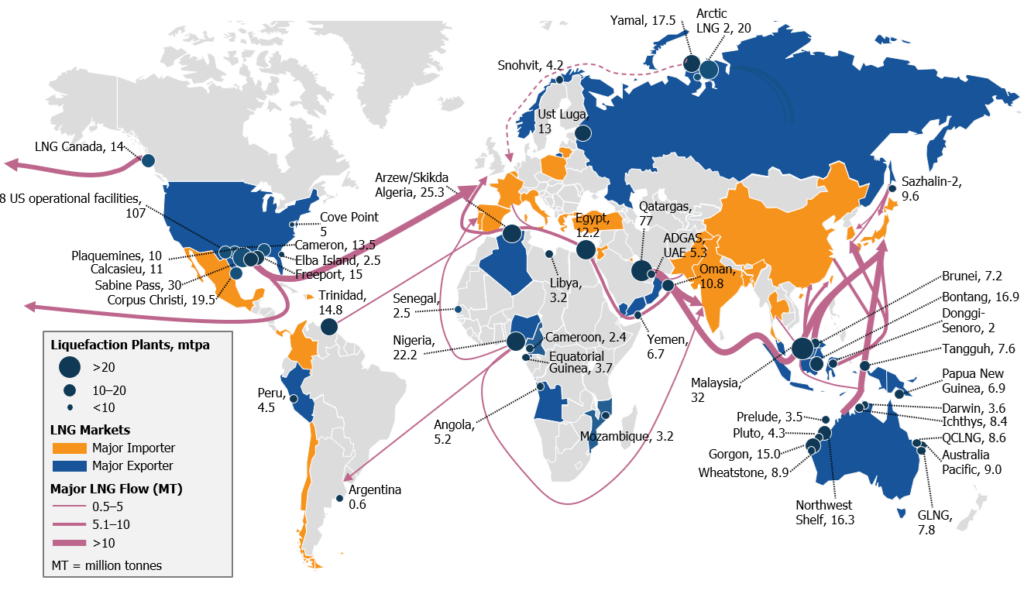
November 13, 2025
Worldwide liquefied natural gas (LNG) liquefaction facilities (operating and under construction), shipping routes, and flows. LNG is flowing to Europe and east Asian markets primarily from the Middle East, Indonesia, Malaysia, Australia, and recently the US.
Australian LNG Projects
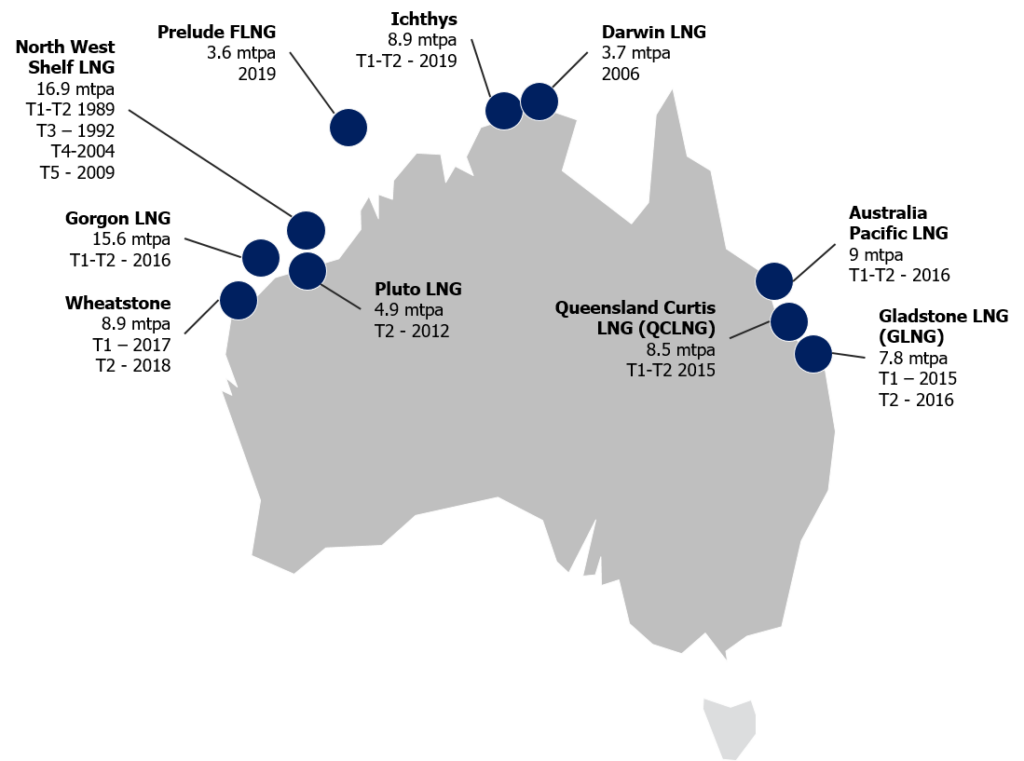
November 13, 2025
Australian liquefied natural gas (LNG) export projects with capacity and operating in-service dates. Currently, Australia has ten operating LNG export facilities; the largest facility is Gorgon, developed by Chevron, ExxonMobil, and Shell.
Russian LNG Export Projects
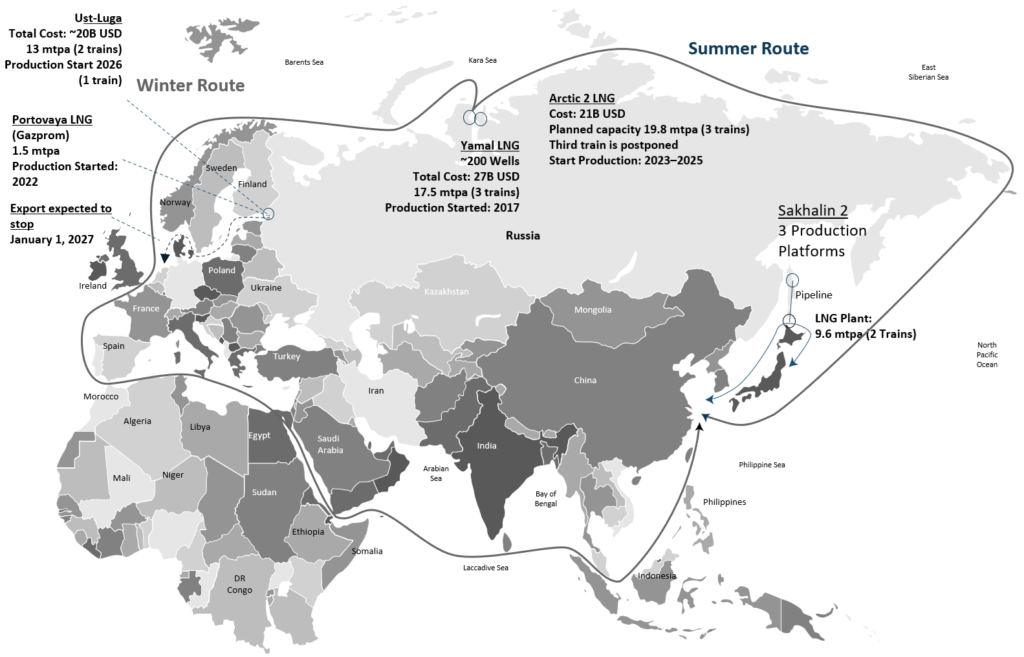
November 13, 2025
Russian liquefied natural gas (LNG) projects showing capacity in million tones per annum (MTPA), operating in-service rates and seasonal shipping routes. The majority of Russian LNG produced will be shipped to the Asia/Pacific region (mostly China) through the Bering Strait in the summer and the Suez Canal in the winter.
World LNG Liquefaction Capacity Growth
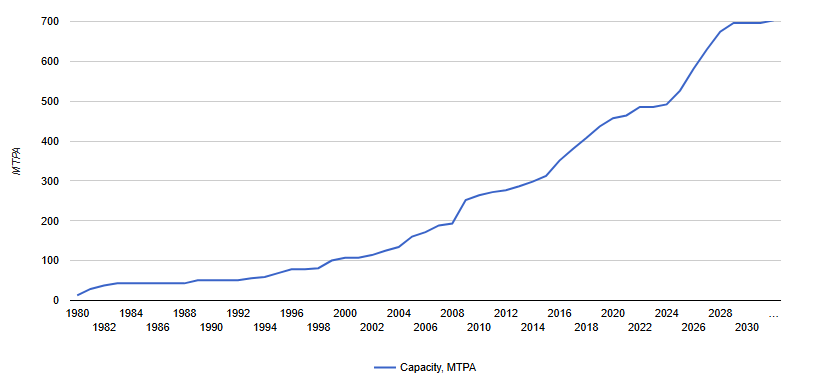
November 12, 2025
Forecast of world liquefied natural gas (LNG) liquefaction capacity growth through 2032, in MTPA (million tons per annum). Early last year, liquefaction projects totaling 700 MTPA were proposed, primarily in the US and Canada, although most will be uneconomical and not be built.
World LNG Liquefaction Capacity Growth by Project
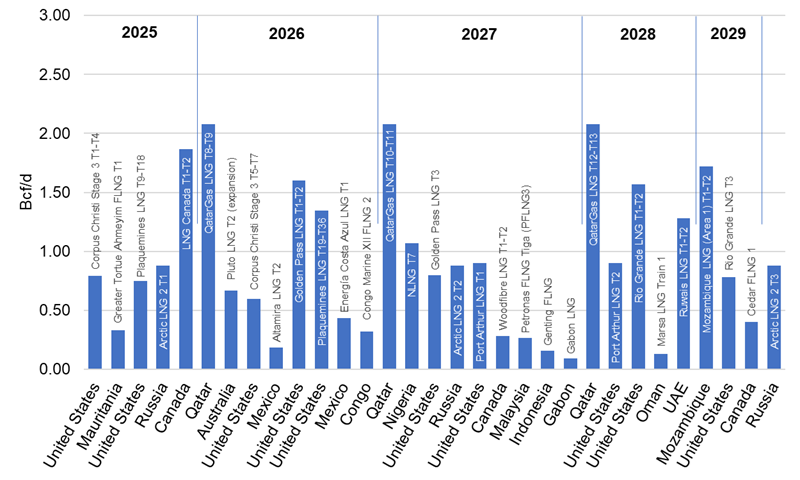
November 12, 2025
The chart presents upcoming LNG liquefaction projects scheduled between 2025 and 2032, highlighting global efforts to expand supply capacity amid ongoing shifts in energy trade.
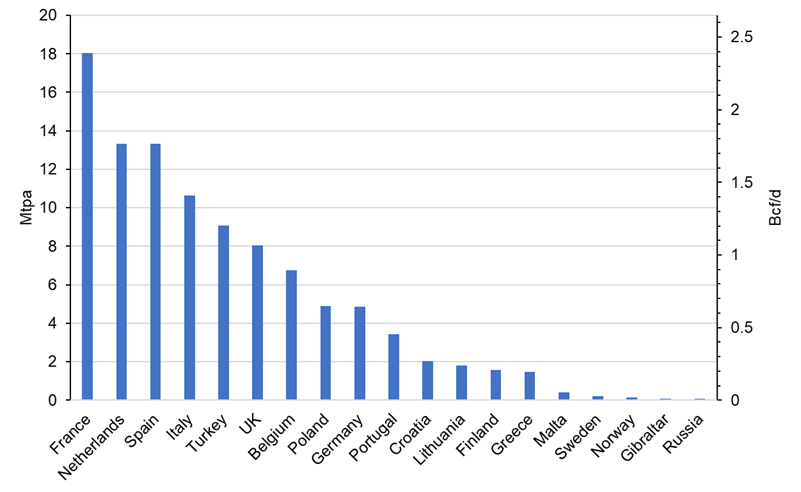
European LNG Imports
November 13, 2025
France led European LNG imports in 2024 with 18.0 mtpa (~2.4 Bcf/d), followed by the Netherlands 13.3mtpa (1.78 Bcf/d) and Spain 13.3 mtpa (~1.8 Bcf/d). Italy and Turkey also remained major importers, with 10.7 mtpa (~1.4 Bcf/d) and 9.1 mtpa (~1.2 Bcf/d), respectively. Collectively, these five countries accounted for more than 66% of total European LNG imports.
Chinese LNG Demand
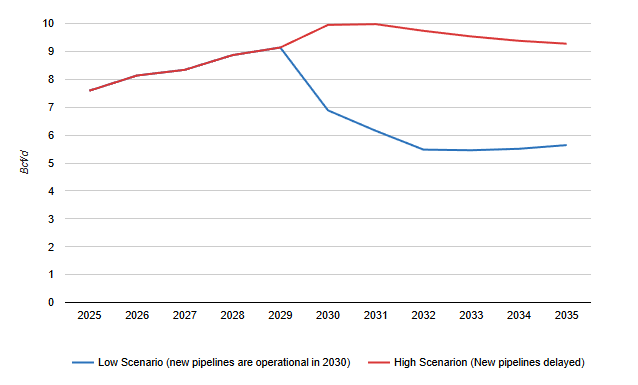
October 15, 2025
Forecasted Chinese LNG demand, calculated as the difference between total supply required to meet demand less domestic production and pipeline imports. The High scenario is associated with delays in construction of new large pipelines (Line D and Power of Siberia 2) and yields a peak of about 10 Bcf/d of LNG imports by 2030. The low case scenario results if new large pipelines are operational by 2030.
LNG Shipping Distances To Asia (Approximate)
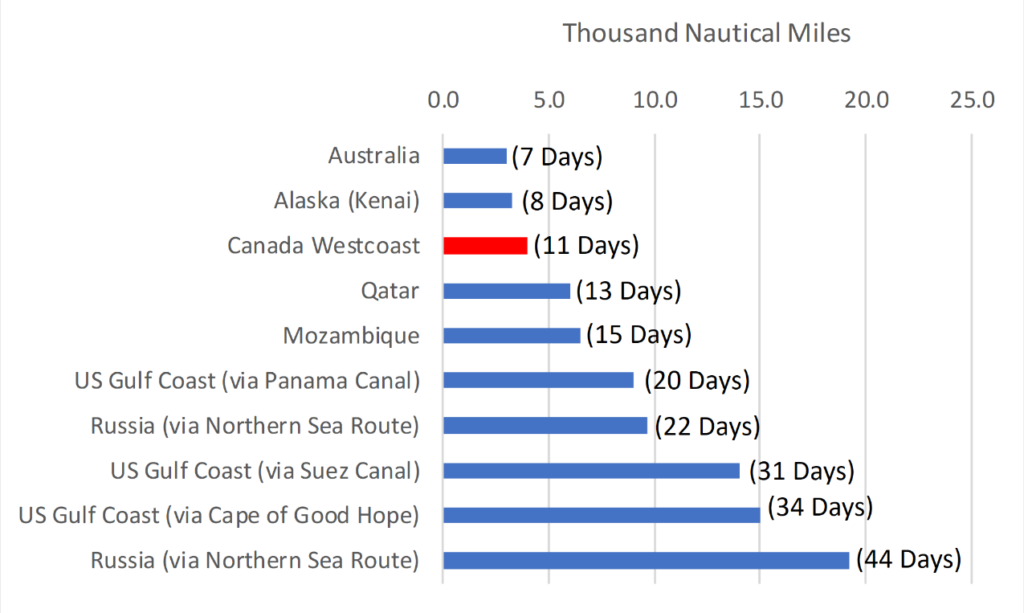
January 11, 2024
Shipping costs are a large component of the delivered price of LNG. The longer the voyage, the higher the transportation costs.
US LNG
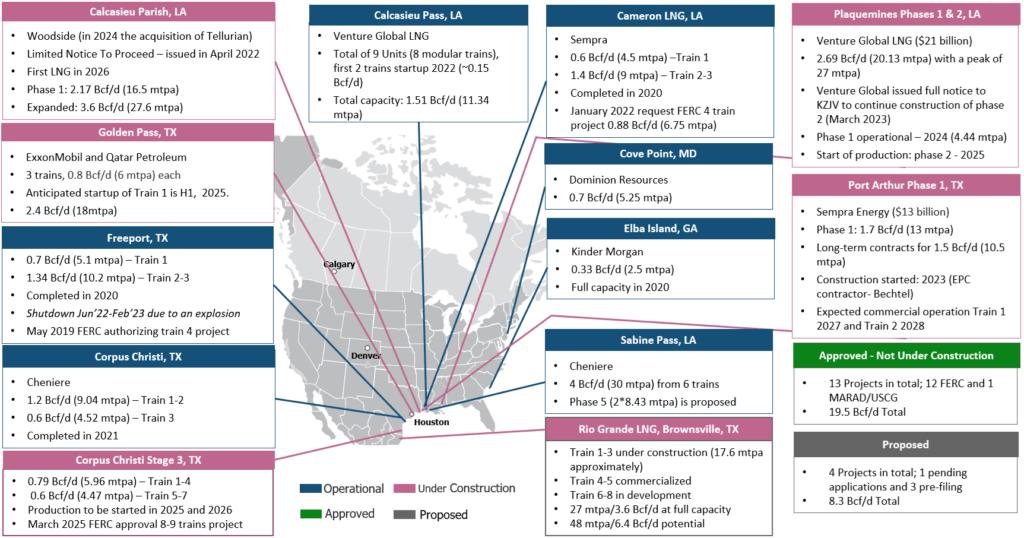
US LNG Projects by Status
November 12, 2025
Status of the operational and under-construction US liquefied natural gas (LNG) export projects, including capacities in million tonnes per annum (MTPA) and in-service dates.
The U.S. became the world’s largest LNG producer by installed capacity in 2024 driven by the boom in LNG plant construction. As of today there are 6 projects under construction phase in USA (with total capacity above 107 mtpa or 14.3 Bcf/d). These projects represent more than 100% of the current capacity in USA (12,2 Bcf/d) and planned to be on full capacity already in Y2029.
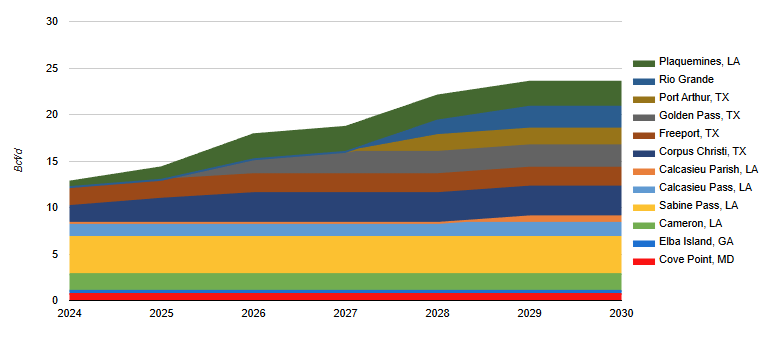
US LNG Capacity Forecast to 2030
November 13, 2025
Forecast to 2030 of North American liquified natural gas (LNG) capacity from US facilities. Additional map showing the locations of the facilities.
Alaska LNG Projects
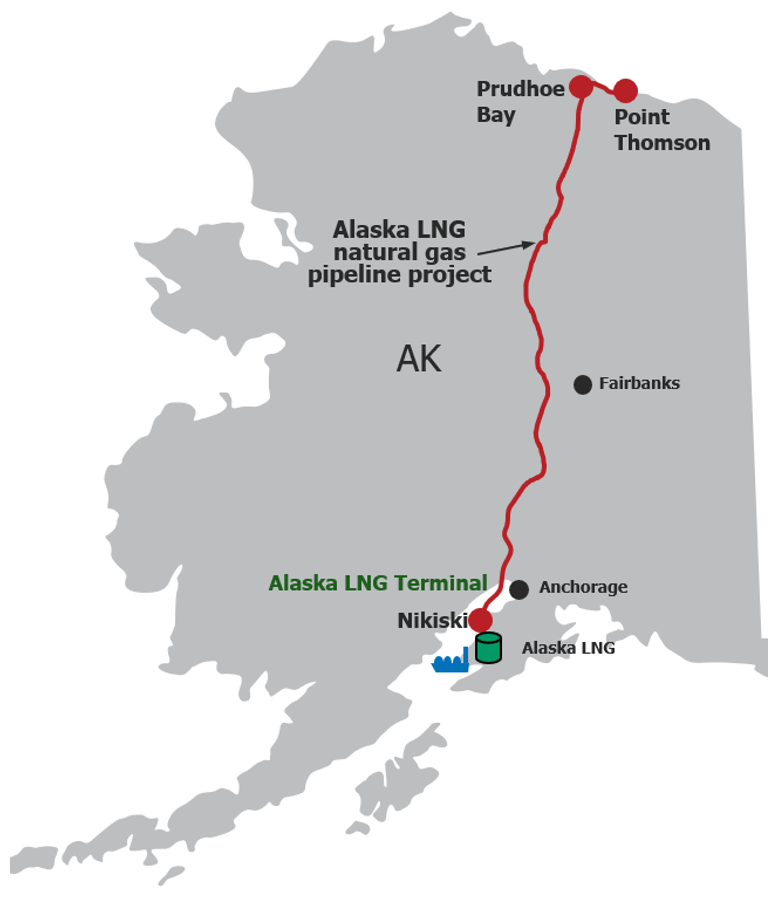
November 13, 2025
The Alaska liquefied natural gas (LNG) project and corresponding pipeline, from the North Slope to southcentral Alaska. Proponent: Alaska Gasline Development Corporation (AGDC)
Canadian LNG
West Coast Canada LNG Export Projects by Status
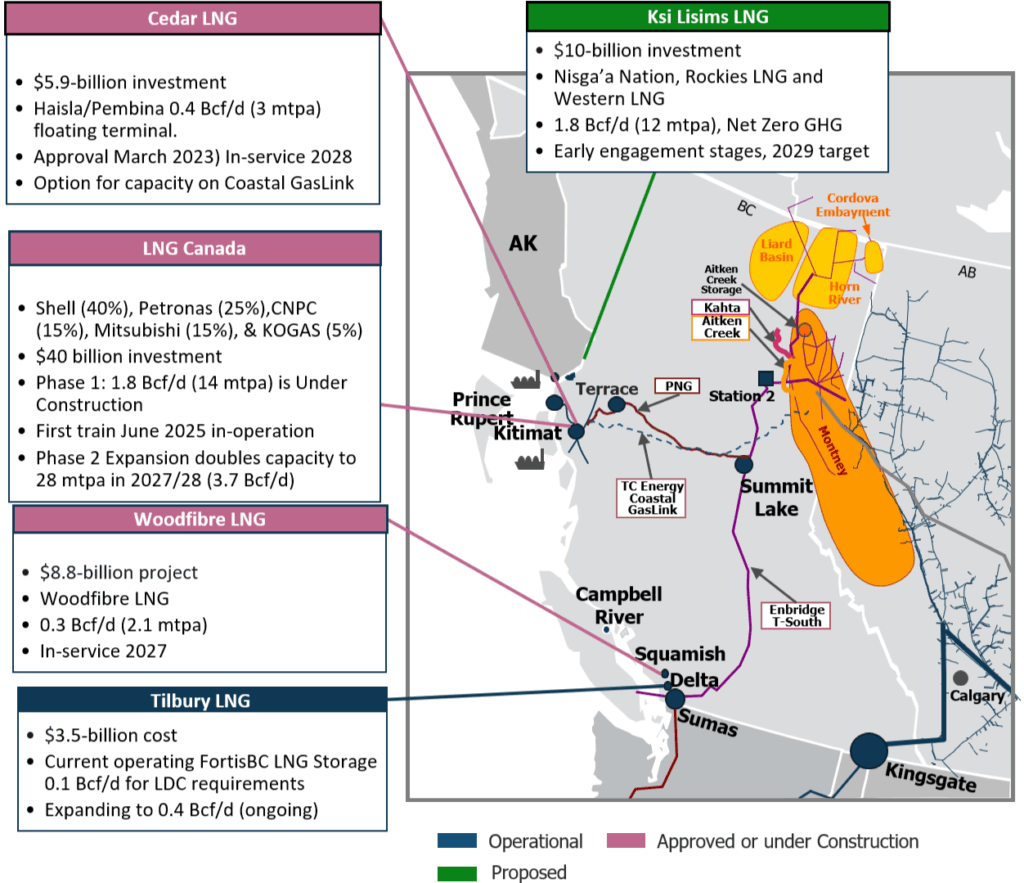
November 14, 2025
Status of the operational, under-construction, and proposed Canadian liquefied natural gas (LNG) projects, including capacities and in-service dates. Access to pipeline connectivity is a crucial piece for developing western Canada LNG export liquefaction projects.
LNG Canada (Kitimat, BC) — OPERATING
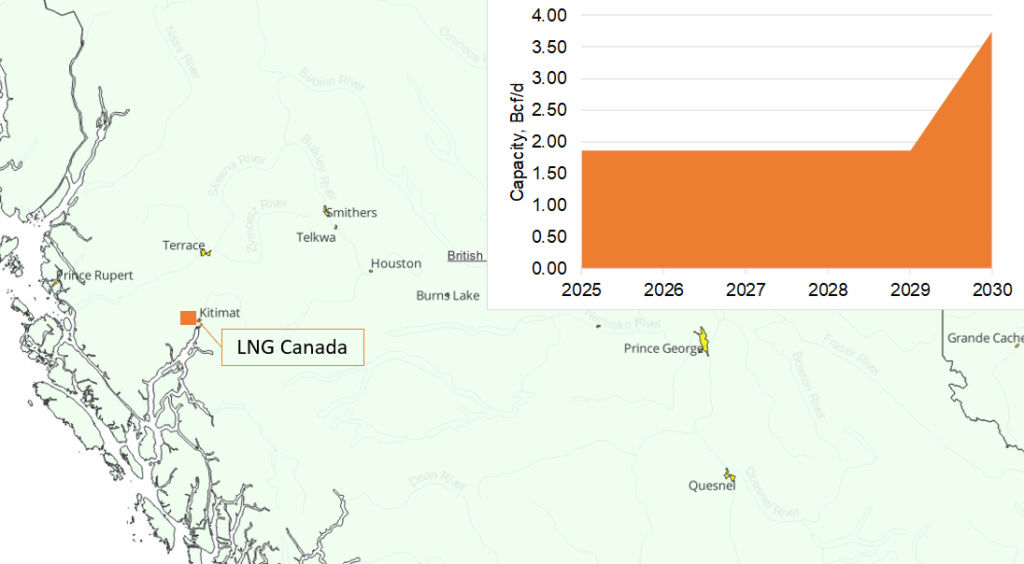
October 30, 2025
In 2018, LNG Canada reached its Final Investment Decision (FID), the largest private-sector investment in Canadian history, committing to a two-train, 14 mtpa facility in Kitimat. Between 2019 and 2023, the project focused on major construction: building the Coastal GasLink pipeline, terminal foundations, storage tanks, and marine facilities.
Woodfibre LNG (Squamish, BC) — UNDER CONSTRUCTION
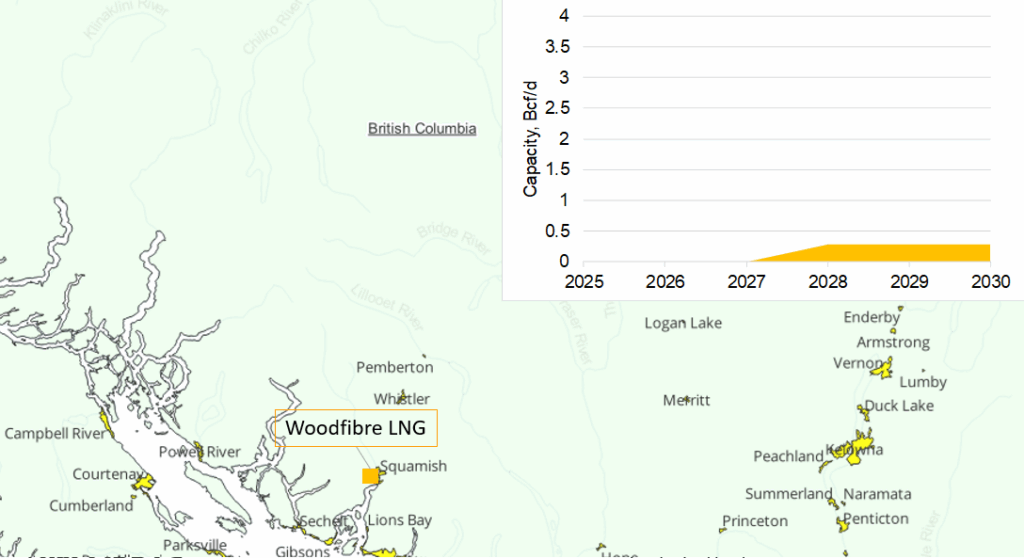
October 30, 2025
In 2015–2016, Woodfibre LNG cleared fundamental regulatory hurdles: the Squamish Nation approved its Environmental Assessment (Oct 14, 2015), followed by the provincial EAO issuing the Environmental Assessment Certificate (Oct 26, 2015).
Cedar LNG (Kitimat, BC) — FID, Under Construction
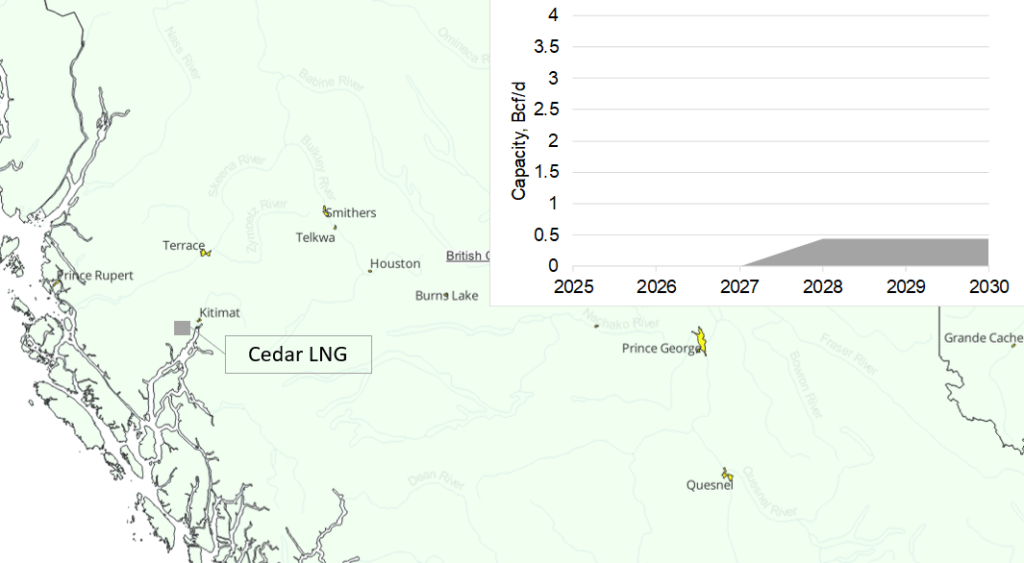
October 30, 2025
In 2025, the project entered a new phase of visible execution. The first pipeline segments were installed, marking a tangible shift from paper approvals to real infrastructure. The BC government committed CA$145 million to electrification lines and substations, cementing Cedar’s low-carbon credentials.
Tilbury LNG (Delta, BC) — Small-Scale, Expanding
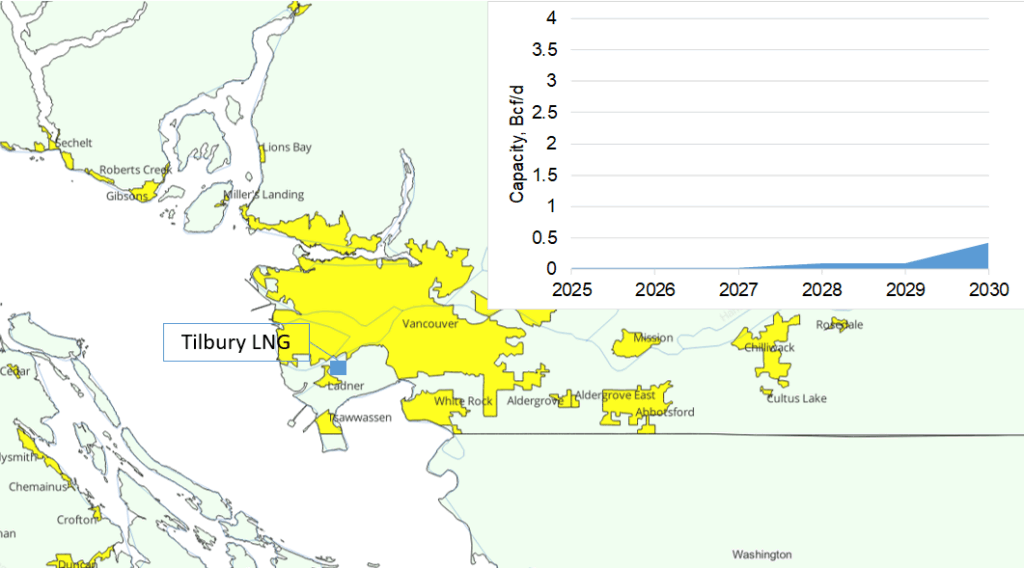
October 30, 2025
In 1971 Tilbury began operations as British Columbia’s first LNG facility, initially serving peak winter demand through storage and peak-shaving supply. In 2019 (Phase 1A): Expansion commissioned, adding a 46,000 m³ storage tank and around 0.25 mtpa liquefaction capacity, enabling marine fuel use and first exports to China.
Ksi Lisims LNG (Nisg̱a’a Nation, BC) — Proposed
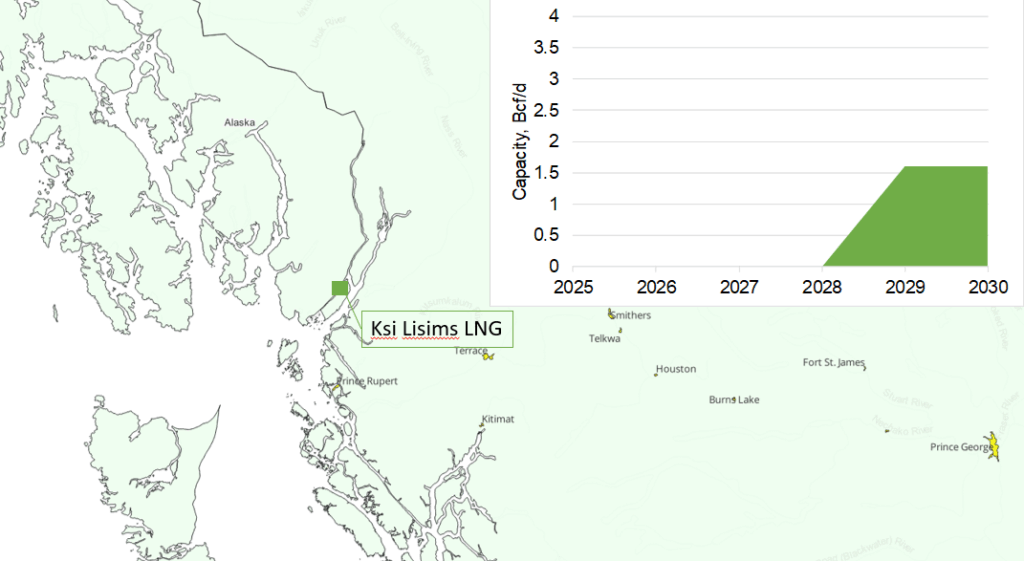
October 30, 2025
From 2014 to 2023, the Ksi Lisims LNG project was in the early stages of regulatory planning. A 40-year export license was granted in 2022, and project proponents filed environmental certificate applications in 2023 while selecting FEED and low-carbon compression partners in collaboration with Siemens and Black & Veatch.
Churchill LNG / Port of Churchill — Proposed
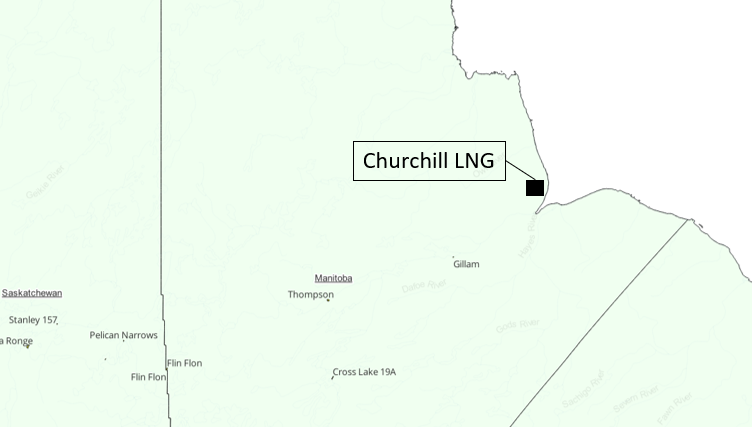
October 30, 2025
Prime Minister Mark Carney announced during his visit to Berlin in August 2025 that Canada plans a major redevelopment of the Port of Churchill in Manitoba. The goal is to turn it into a viable LNG export gateway to Germany and global markets. This includes initiating discussions with German buyers for LNG exports.
Newfoundland LNG — Proposed
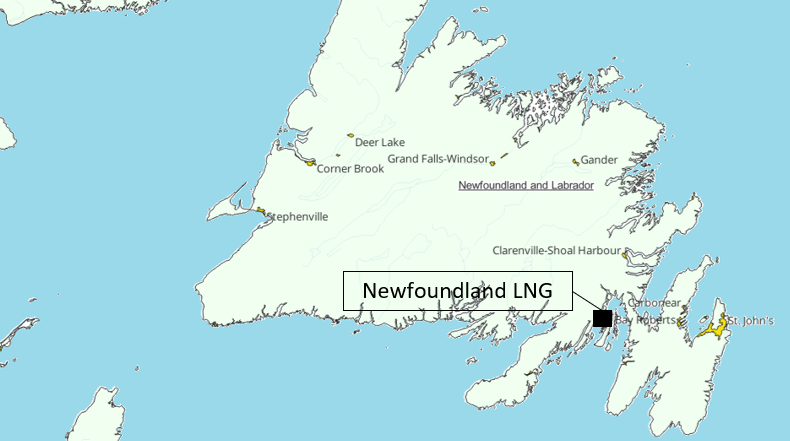
October 30, 2025
Newfoundland LNG (Grassy Point, Placentia Bay) – First proposed in the mid-2000s by a consortium (North Atlantic Pipeline Partners, later Newfoundland LNG Ltd.) to build an import terminal, later converted to an export concept.
The Business Case for Canadian LNG – Part 3 – Killing the Golden Goose
July 7, 2025
In this last Part 3, we look back at the history of LNG liquefaction projects in Canada, and the progression of federal and provincial policies that are the primary impediment to new large-scale development: Killing the Golden Goose.
The Business Case for Canadian LNG – Part 2
April 23, 2025
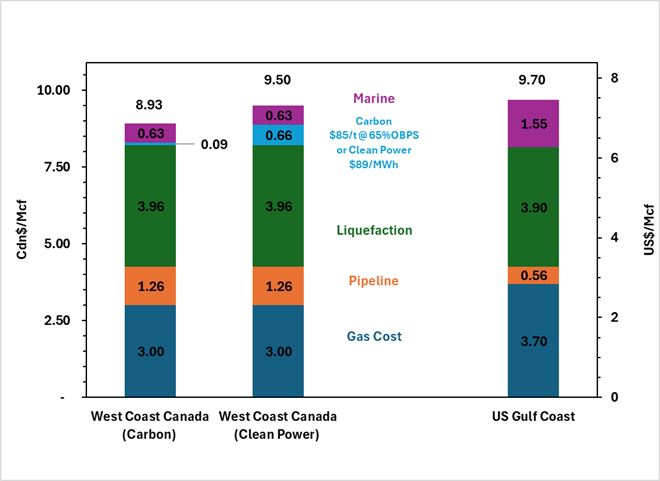
In this Part 2, we examine the competitive economics for west coast Canada LNG. As we will demonstrate, the economics are in west coast BC’s favour when compared to US Gulf Coast (USGC) Projects. It is only after costs associated with made-in-Canada legislation and policies are included, that major LNG Projects, on the scale of LNG Canada, are challenged.
The Business Case for Canadian LNG – Part 1
April 15, 2024
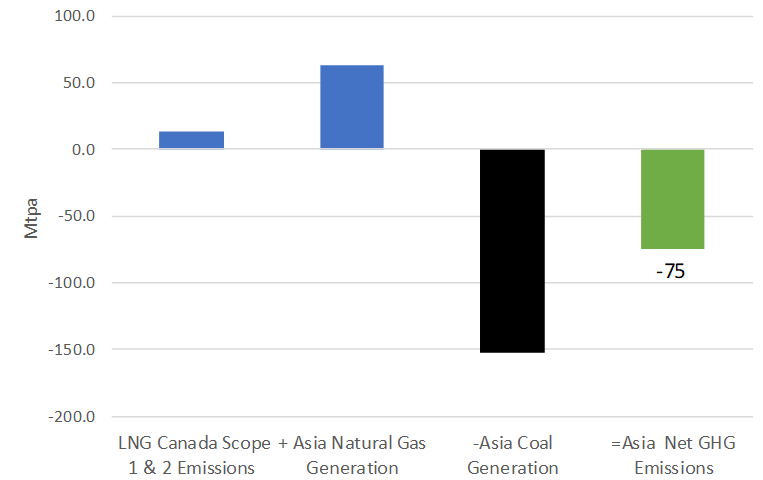
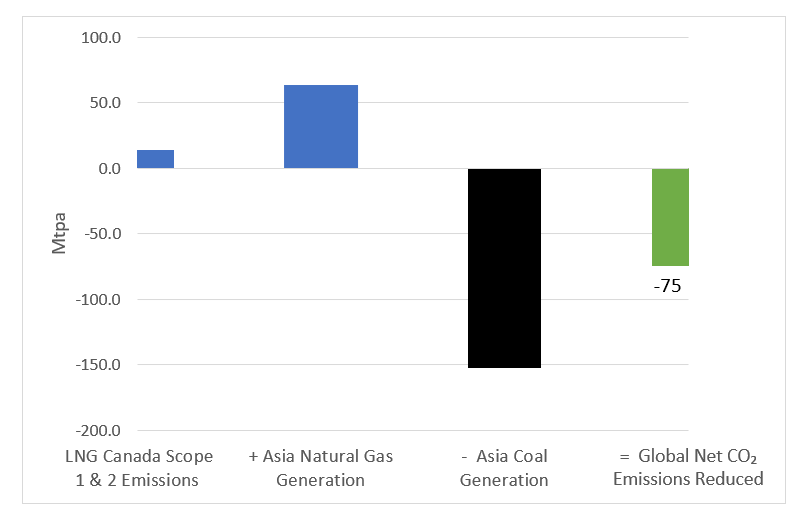
Natural gas power generation has a significantly lower CO2 emissions intensity than coal-fired power. Further, Canada also has lower ambient temperatures than most other LNG producing jurisdictions resulting in much lower CO2 emissions intensity than competing LNG projects in Australia, the US Gulf Coast (USGC) and Qatar.
Incorrys analyzed LNG Canada’s 3.2 Bcf/d of gas exports, and their net impact on global GHG emissions, if used to displace coal-fired power generation in Asia (“displacing heavier hydrocarbons” as Minister Wilkinson suggests). For the LNG Canada project alone, which is due to come online in 2025, Incorrys forecasts a minimum* net reduction in global GHG emissions of 75 mtpa of CO2e.
Canadian LNG Exports Forecast to 2035
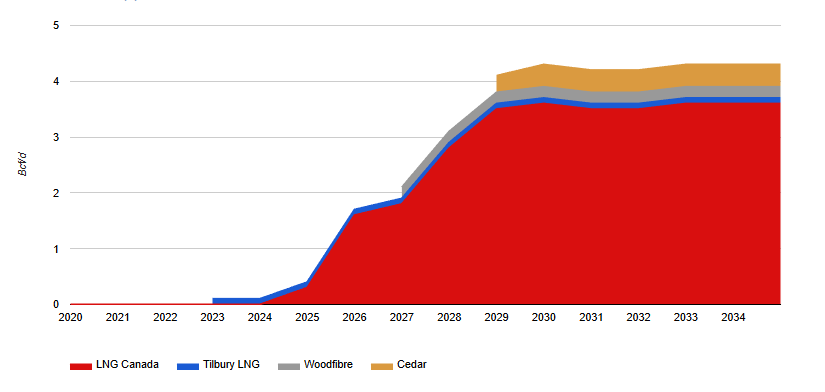
February 09, 2026
Forecast to 2035 of Canadian liquefied natural gas (LNG) exports led by Shell’s LNG Canada facility on the west coast. Also discusses the impact LNG Canada will have on Canada’s supply/demand. Additional map showing the locations and pipelines supplying facilities.