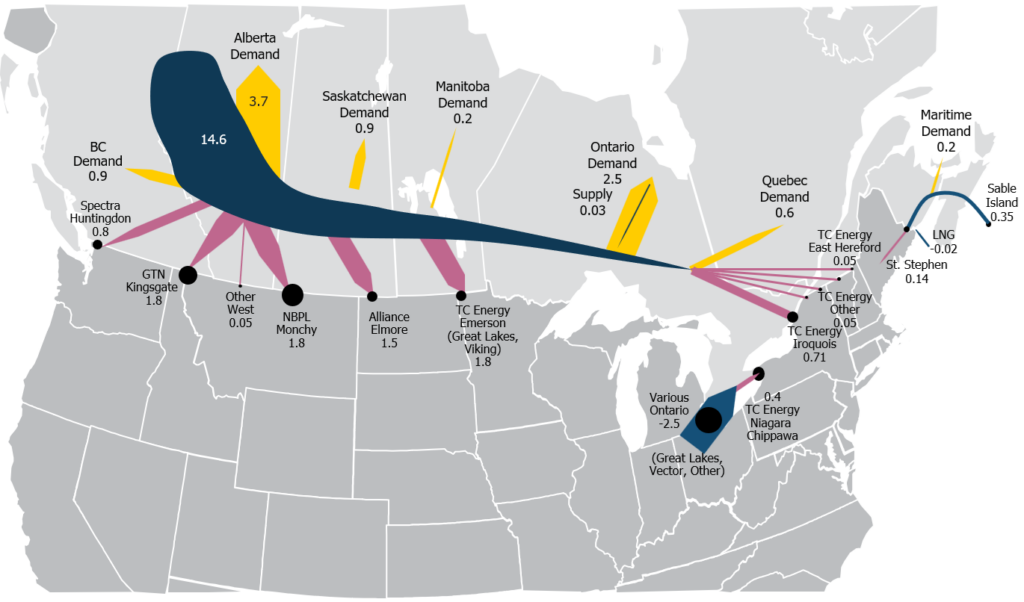
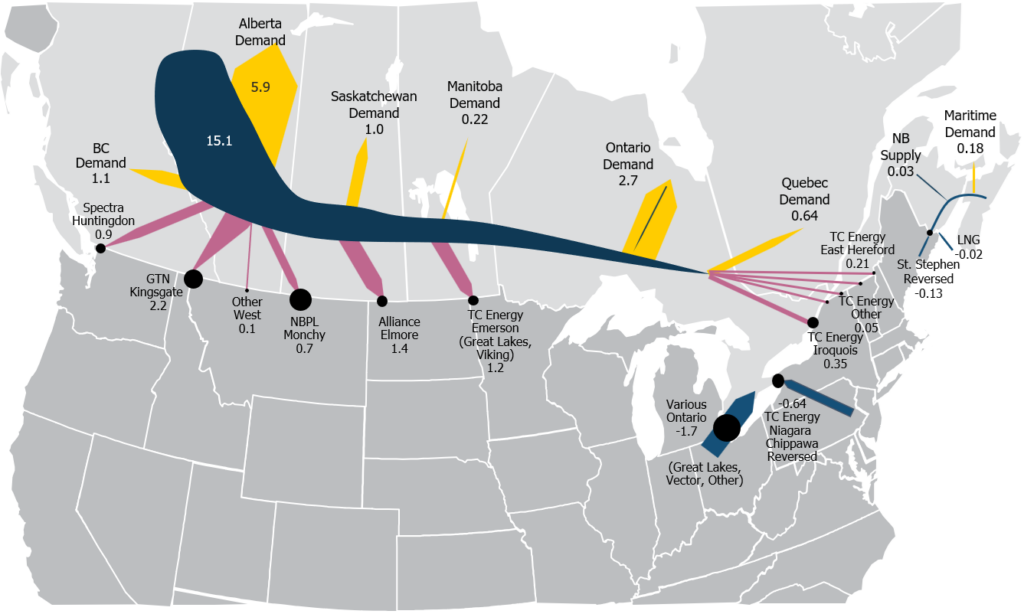
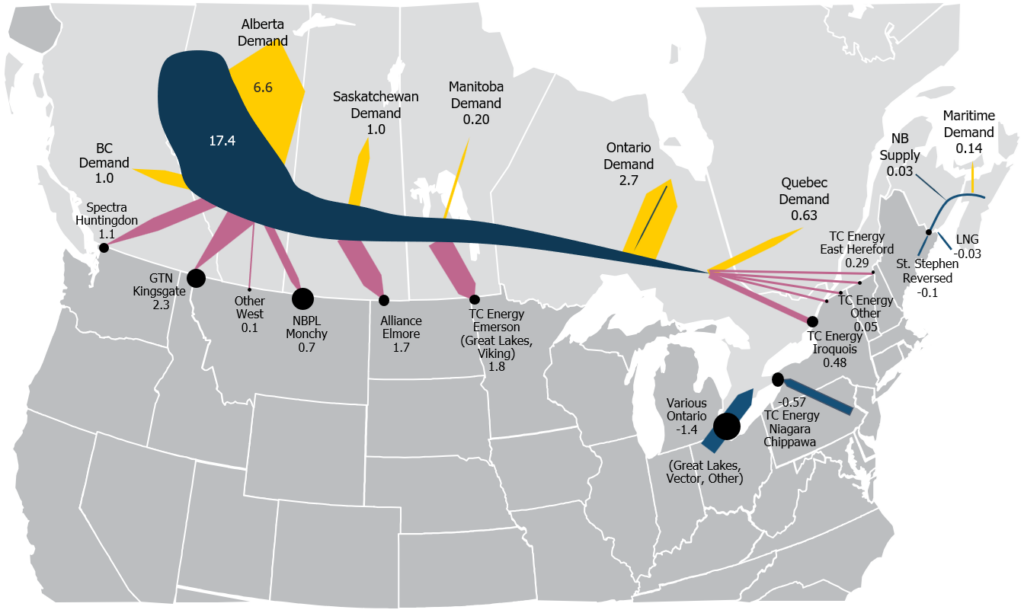
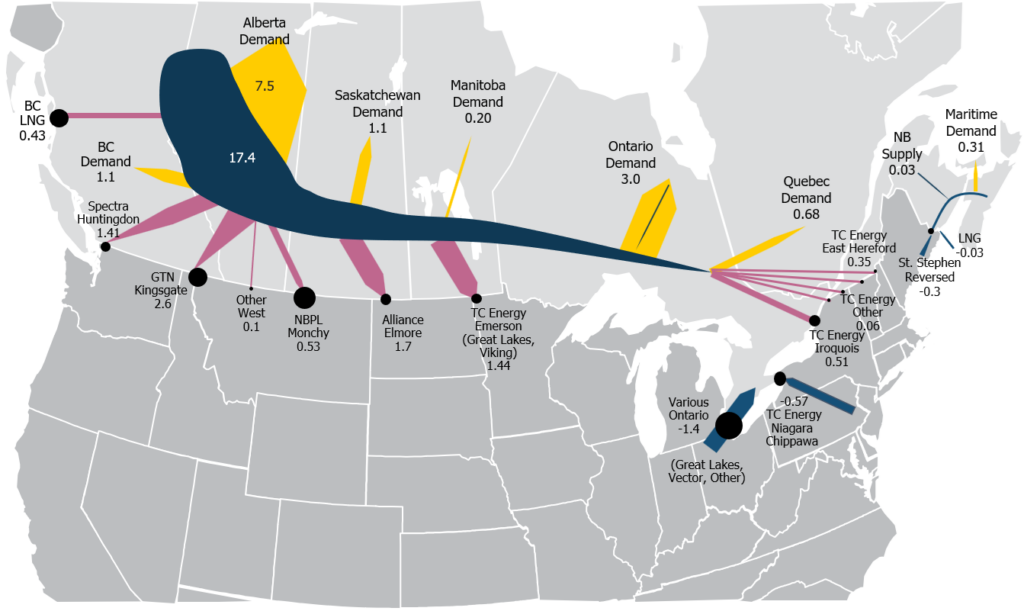
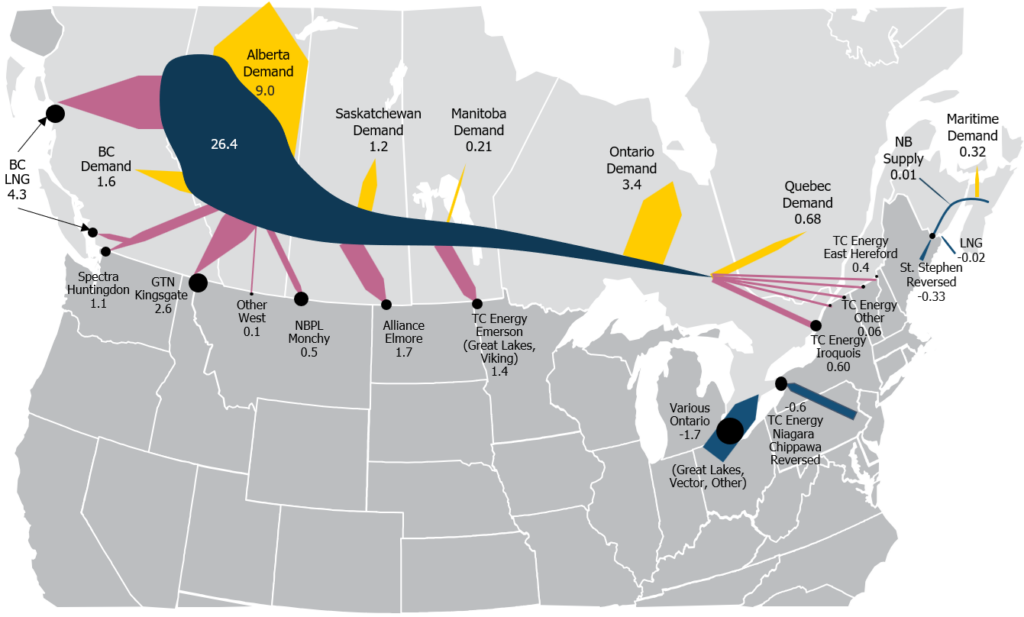
July 7, 2023

2010

These charts provide an overview of the supply-demand balance of Canadian exports/imports for 2010, 2020, 2021, and 2030 in Bcf/d.

In 2010, there was 14.6 Bcfd of supply in Western Canada plus a little incremental supply in the maritime provinces from Sable Island (350 MMcfd) that met Maritime demand and some export opportunities at Saint Stephen. Going from left to right; BC demand at about a 1 Bcfd (mainly for core heating demand), Spectra-Huntington exports into Pacific Northwest of 800 MMcfd; GTN-Kingsgate at 1.8 Bcfd of capacity ultimately flowing into California. Alberta demand is almost 4 Bcfd, Northern Border at 1.8 Bcfd (close to their ultimate 2.1 capacity), and Alliance flowing basically at capacity of 1.5 Bcfd. Moving eastward; Saskatchewan demand is about 1 Bcfd, Manitoba much smaller at 0.2 Bcfd as there is plenty of hydro-power so many use electric heating rather than natural gas. Ontario has very little supply of its own and has demand of 2.5 Bcfd while Quebec just over 0.5 Bcfd of demand – basically split 2/3 core demand 1/3 industrial. There is not a lot of power demand in Quebec as they are basically a large hydro exporter into the New England area. In the Eastern Triangle market, Dawn imported about 2.5 a day while we show exports on Iroquois fairly strong and Niagara/Chippewa down to 0.4 Bcfd day as we have Marcellus starting to ramp up at 2010 time period.

2020

In 2020, Western Canada supplies are up almost 1 Bcfd. We see flows at Dawn off as these flows have been crowded out by the Niagara/Chippewa reversing from export to import. Compared to 2010; GTN is up 0.4 Bcfd, Spectra-Huntington up 0.1 Bcfd; Northern Border off by about 1 Bcfd; Alliance essentially at capacity, and Alberta demand up strongly (over 2 Bcfd) primarily to meet oil sands growth. Demand in Saskatchewan, Manitoba, Ontario, and Quebec is flat. Iroquois pipeline basically switches to peaking mode where it basically flows at capacity in the winter months to meet heating demand, strong flows in the summer to meet cooling load and down to a trickle in the shoulder seasons. East Hereford into PNGTS is up to 200 MMcfd from about 50 MMcfd in 2010. St. Stephens has now reversed and is feeding Maritime demand since Sable island has been shuttered. These imports are supplemented with some LNG imports and small amount of supply in New Brunswick from a shale gas play where there is lots of pushback in terms of fracking. Therefore, this supply source has not developed very quickly.

2022

Compared to 2020, Western Canada supply is up 2.3 Bcfd with increased demand for Alberta oil sands eating up about half of the supply increase (1.2 Bcfd).  BC demand is down slightly with exports at via GTN and Spectra-Huntington up marginally while Northern Border is flat; Alliance is up 0.3 Bcfd with the startup of the Three Rivers Interconnection Project that will feed the 1300 MW combined  expansion. Demand in Saskatchewan, Manitoba, Ontario, and Quebec, plus the majority of eastern import/export points,  are generally running similar to 2020.

2030

In 2030, Alberta supply increases sharply, up almost 6 Bcfd compared to 2021, primarily to feed the 3.4 Bcfd LNG Canada export project on the west coast (assumes all 4 proposed trains) and to meet growing Canadian demand. We expect Alberta demand to increase another 1.4 Bcfd today to meet continued oil sands growth. Oil prices in 2023 are at about USD$75/bbl WTI level which is certainly strong enough for oil sands development. Incorrys does not expect a lot of capital will be spent the next year in Alberta as producers looking to grow oil sands are looking improve their balance sheets from the low prices we had in first and second quarter at 2020 (~$35). However, there are growth prospects at $35 like bottlenecking and other enhancements which adds another 0.5 MMbbl/d at less than $50 WTI. As such, we expect another 1.0 MMbbl/d of growth in the oil sands by 2030, enough to basically fill up the Line 3 completion through Minnesota and the Trans Mountain expansion that’s being constructed today to the West Coast of Canada. So, this increase of 1.0 MMbbl/d will basically take us to capacity by 2030; without Keystone, we can add that million barrels to Alberta. The GTN Express adds about 300 MMcfd of capacity by 2022, Northern Border is down to a trickle as the Bakken continues to recover and grow, and Alliance sees strong flows into Chicago as it is very economical as they can sell those liquids into the Chicago market and get a premium over what they can get in the Ft Saskatchewan area in Alberta. Great Lakes remains strong, Viking is slightly enhanced, and Saskatchewan demand growth with some coal closures.  Ontario nuclear refurbishments enhance demand and Quebec is still fairly flat, increased flows into Dawn, and Iroquois up slightly from a compression project that allows them to deliver more gas in those peaking months. PNGTS enhancements increase exports into a New England, which is starved for pipe, by about 300 MMcfd, and Maritime demand growing mostly due to coal plant shuttering and the pull from that supply-short New England area.