

Forecast of Electric Vehicle Stocks and Annual Sales
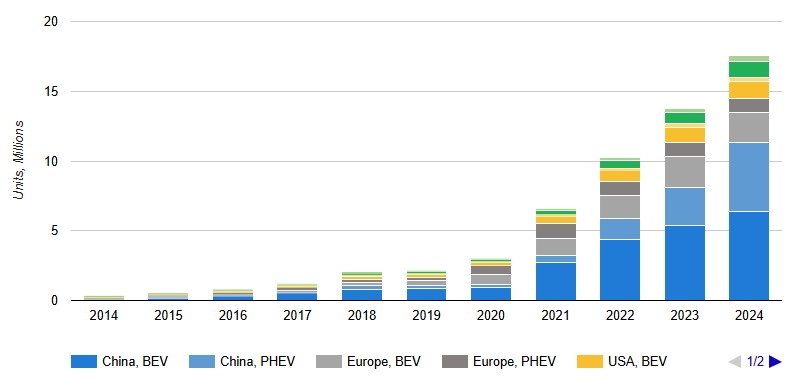
Electric Passenger Cars Sales 2014-2024
March 19, 2026
Global electric passenger car sales surged from 0.33 million in 2014 to 17.5 million in 2024, driven by policy support, falling battery costs, and stricter emissions rules. China leads with a dominant market share, followed by Europe and the United States. Growth accelerated through 2020–2023 but began to slow after 2023, with BEVs remaining the majority technology.
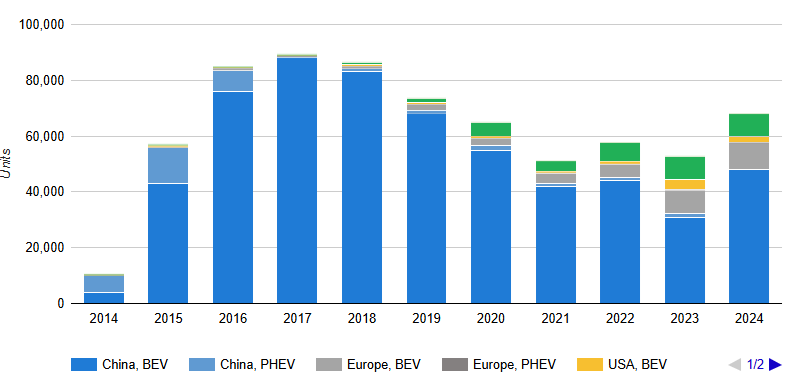
Electric Buses Sales 2014-2024
March 19, 2026
Global electric bus adoption is overwhelmingly driven by China, which dominates sales and favors BEVs over PHEVs. While Europe and other regions are expanding steadily, their volumes remain much smaller. The United States remains a niche market. Overall, electrification in public transport is led by BEVs, with PHEVs playing only a limited transitional role worldwide.
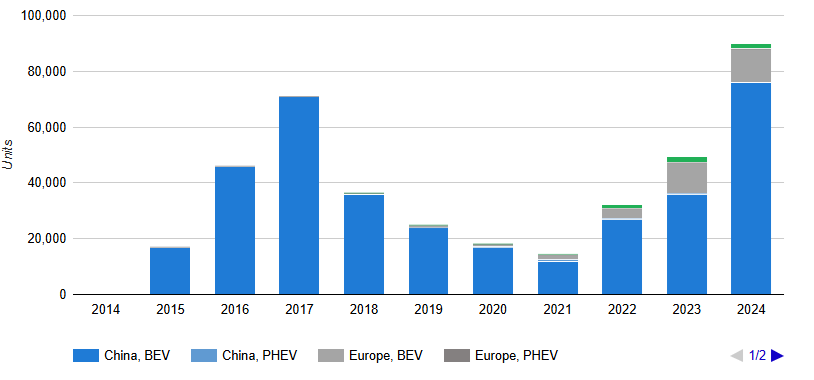
Electric Trucks Sales 2014-2024
March 19, 2026
Global electric truck sales are accelerating from a low base, led by China’s early dominance and Europe’s rapid recent growth. BEV trucks account for the vast majority of adoption, while PHEVs remain marginal across all regions. China drives volumes through policy cycles, while Europe scales quickly after 2021. Other regions are still in early pilot stages of electrification.
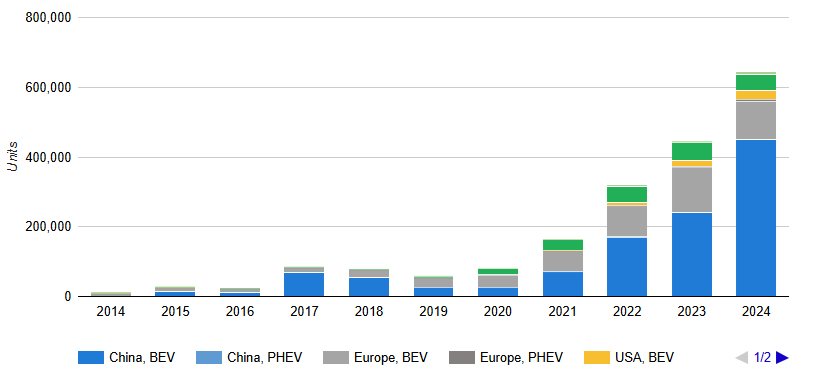
Electric Vans Sales 2014-2024
March 19, 2026
Global electric van sales have surged since 2020, driven by rapid electrification of urban delivery fleets. China leads by a wide margin, while Europe shows strong and balanced growth in both BEVs and PHEVs. The United States is expanding more slowly, and other regions are scaling from a low base. Overall, BEVs dominate this segment of commercial transport.
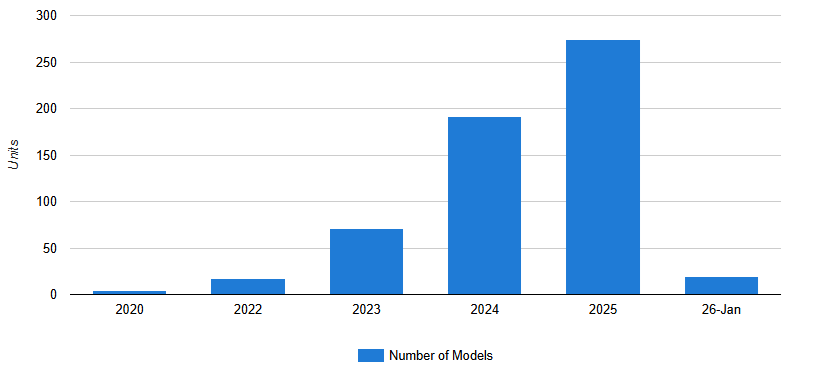
Number Of BEV Models Per Year
March 20, 2026
The number of BEV models continues to grow rapidly, reaching around 275 in 2025 as automakers expand their electric portfolios across multiple vehicle segments. At the same time, many earlier models are being discontinued due to fast-changing market conditions. This trend highlights a transition from early EV adoption to large-scale competition and portfolio optimization by global manufacturers.
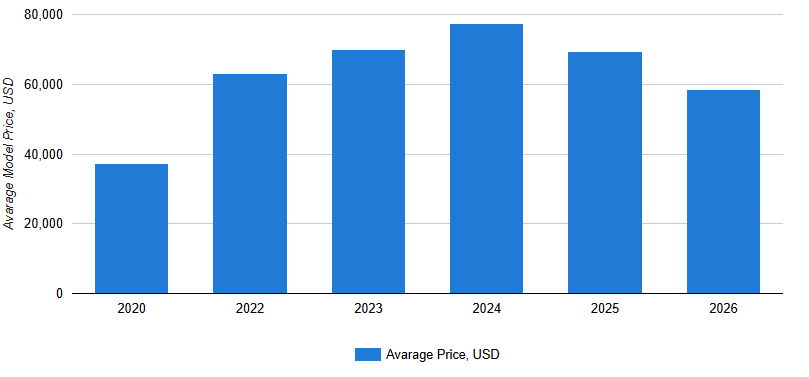
Average BEV Price Per Year
March 20, 2026
Average BEV prices rose sharply in the early 2020s, driven by premium models, high battery costs, and supply chain constraints, peaking around $77,000 in 2024. Since then, prices have declined as more mass-market models enter the market. This shift reflects stronger competition, falling battery costs, and a transition toward greater affordability and wider EV adoption.
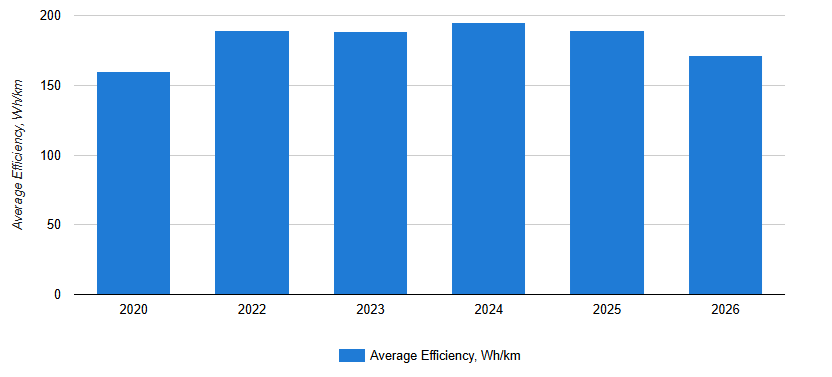
Average BEV Efficiency Per Year
March 20, 2026
Average BEV efficiency has remained relatively stable, increasing from about 160 Wh/km in 2020 to around 195 Wh/km in 2024. Gains have been offset by the growing share of larger, less efficient SUVs and pickup trucks. While smaller passenger EVs remain more efficient, overall efficiency is expected to stay broadly flat in the coming years.
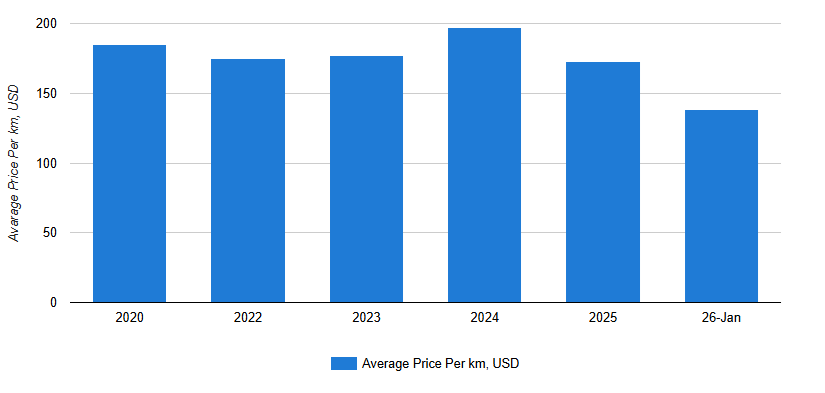
Average Price Of BEV Per km Per Year
March 20, 2026
Average BEV price per kilometer of range is declining over time, reflecting improving cost efficiency and better value for consumers. Despite some short-term fluctuations, advancements in battery technology and increased competition are helping reduce costs relative to driving range. Overall, this trend highlights the growing economic attractiveness of electric vehicles compared to earlier years.
Average Range Per Year
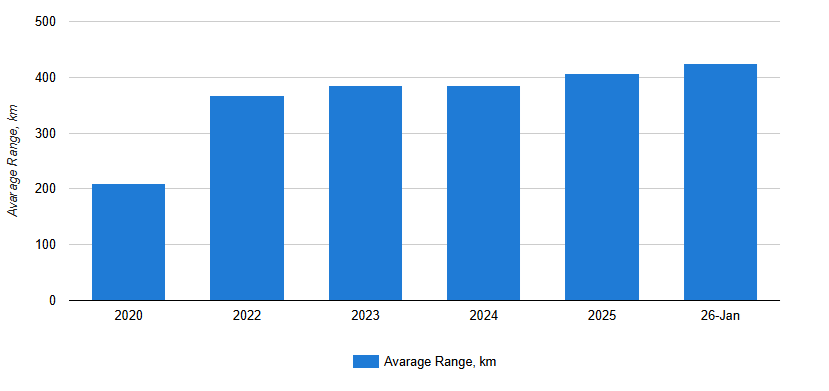
March 20, 2026
Average BEV driving range has increased steadily, rising from about 200 km in 2020 to over 400 km by 2023–2024. Early gains were driven by rapid improvements in battery capacity and efficiency, while growth has since moderated. Overall, increasing range is reducing range anxiety and supporting broader adoption of electric vehicles across global markets.
Total Number of Electric Vehicles in US 2013-2030
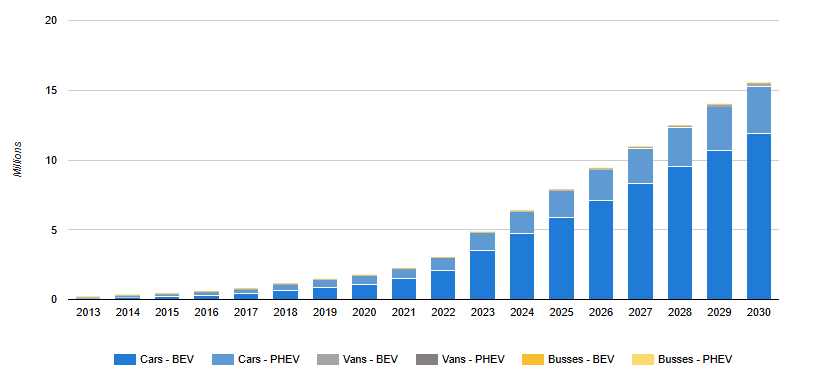
March 20, 2026
By 2030, Incorrys expects the total number of registered electric vehicles in the United States to reach around 16.1 million units. Battery electric vehicles (BEVs), including cars, vans, and buses, are projected to dominate the EV fleet, accounting for roughly 75% of total registered electric vehicles. Plug-in hybrid electric vehicles (PHEVs) are expected to represent about 25% of the total EV stock in 2030.
US Electric Vehicle New Registrations Per Year
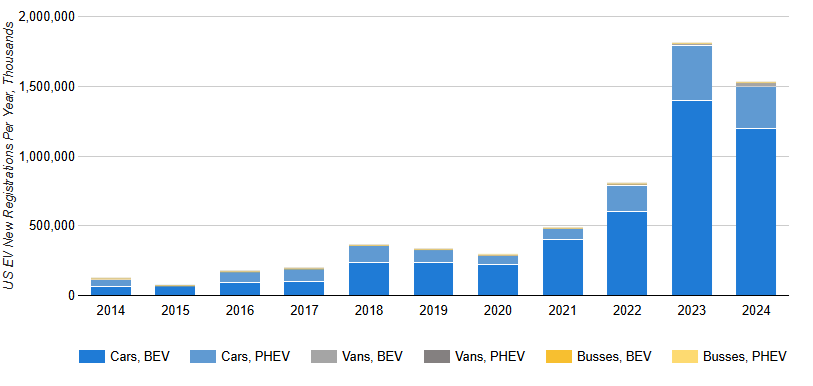
March 20, 2026
U.S. electric vehicle registrations grew rapidly after 2021, reaching about 1.53 million units in 2024. Passenger cars dominate the market, accounting for roughly 98% of new EV additions, with BEVs leading growth. After peaking in 2023, total registrations slightly declined in 2024, indicating a moderation in growth following a period of strong expansion.
Electric Vehicle Stock
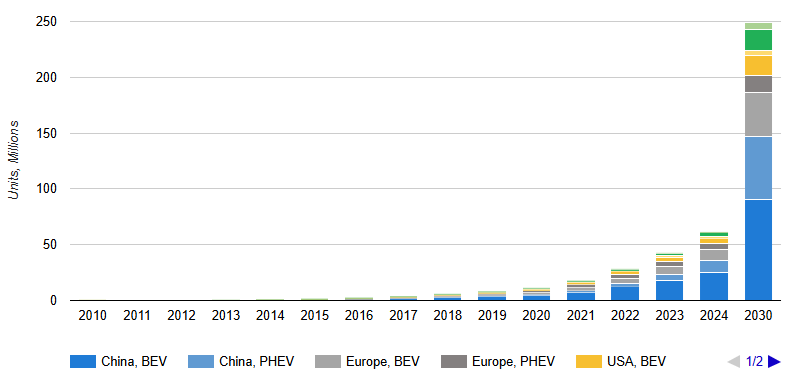
March 23, 2026
Global electric vehicle stock is expanding rapidly, projected to reach around 193 million units by 2030. China leads by a wide margin, followed by Europe and the United States. Growth is primarily driven by BEVs, while PHEVs maintain a secondary but important role. This trend highlights the accelerating shift toward electrification across global vehicle markets.
Global Trend In Electric Car Sales
March 23, 2026
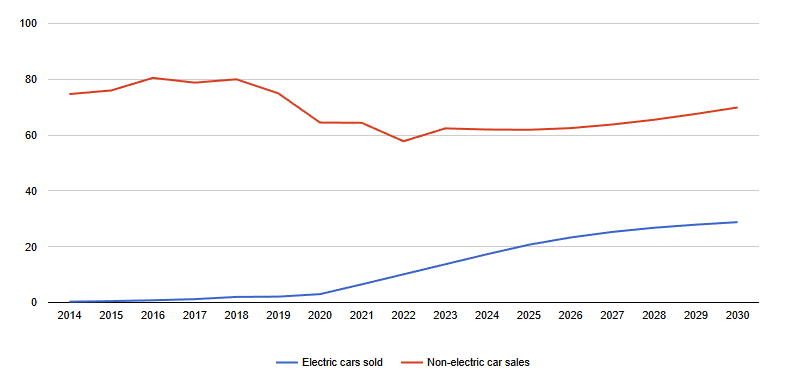
Global electric car sales have grown rapidly, increasing from 0.3 million in 2014 to 17.3 million in 2024, driven by lower battery costs and stricter regulations. Meanwhile, non-electric car sales have declined and remain below pre-2020 levels. As a result, EV market share has risen to 28% and is projected to reach around 41% by 2030.
Battery Technology
Average BEV Battery Capacity Per Year
March 20, 2026
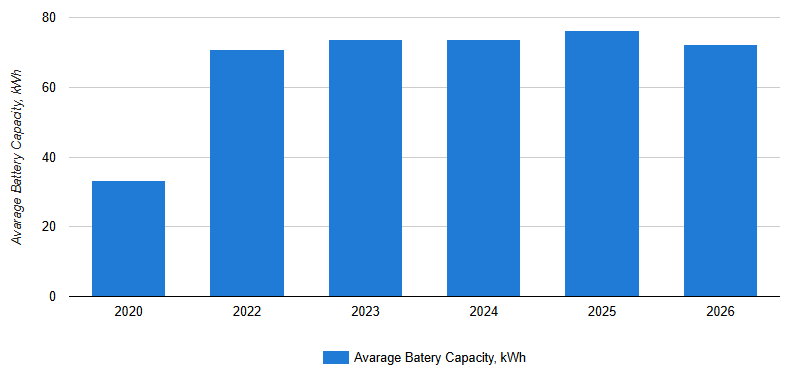
Average BEV battery capacity increased rapidly in the early 2020s, more than doubling from about 33 kWh in 2020 to over 70 kWh by 2022. Growth has since stabilized as more mid-range electric vehicles enter the market. While premium models offer very large batteries, the broader mix of vehicles has kept overall average capacity relatively flat.
Electric Vehicle Battery Cost
March 20, 2026
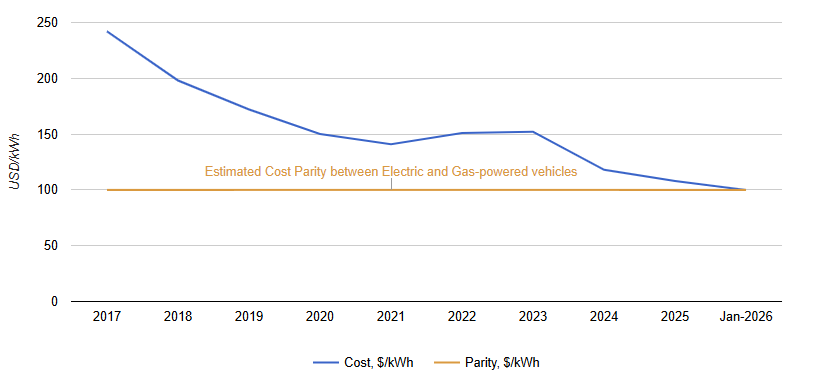
Lithium-ion battery costs continue to decline, reaching around $108/kWh in 2025, driven by scale, technology improvements, and strong cost advantages in China. While prices remain higher in North America and Europe, the gap is narrowing. Falling battery costs are improving EV affordability, with continued progress toward the key $100/kWh threshold and broader market competitiveness.
Charging Infrastructure
Charging Infrastructure for Electric Vehicles 2010-2030
March 23, 2026
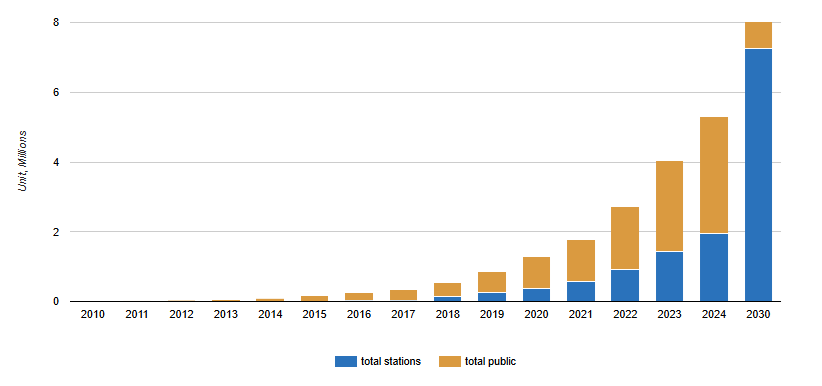
Global EV charging infrastructure has expanded rapidly, reaching about 5.3 million public chargers in 2024 and projected to grow further by 2030. China leads deployment, followed by Europe, while the United States lags behind. Although slow chargers dominate, fast charging is the fastest-growing segment, supporting long-distance travel and enabling higher electric vehicle adoption worldwide.
Charging Time for Electric Vehicles 2020-2026
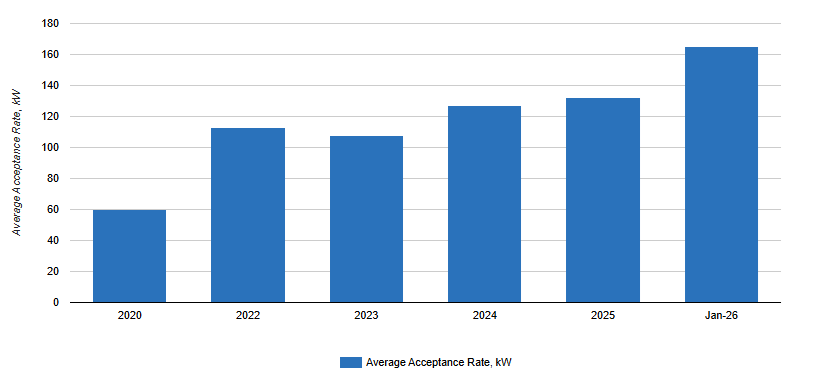
March 20, 2026
EV charging performance has improved significantly, with average charge acceptance rates rising from 60 kW in 2020 to around 165 kW by 2026. These gains reflect advances in battery technology, thermal management, and fast-charging infrastructure. Faster charging times are reducing usability barriers, making electric vehicles more practical for long-distance travel and supporting broader mass-market adoption.
Raw Materials For Electric Vehicles
Cobalt For BEV Batteries 2010-2030

March 26, 2026
Cobalt utilized in batteries has grown from virtually nil in 2010 to over 80,000 tonnes in 2022. Incorrys is forecasting accelerating growth with global demand reaching over 350,000 tonnes by 2030.
Nickel For BEV Batteries 2010-2030

March 26, 2026
Global nickel production has generally been in an upward trend growing from over 1.5 million tonnes in 2010 to 3.3 million tonnes in 2022.
Lithium For BEV Batteries 2010-2030

March 26, 2026
Lithium used in BEV cars has grown from essentially nothing in 2010 to 11,000 tonnes in 2020 however, the growth is expected to accelerate through to 2030 increasing to about 175,000 tonnes.
Copper Requirements Per Vehicle Type 2026

March 26, 2026
Conventional cars with internal combustion engines (ICEs) use the least amount of copper compared to all electric vehicle (EV) types at under 25 kg/vehicle.
Copper For BEV Batteries 2010-2030

March 26, 2026
Copper used in BEV cars has grown from 1 thousand tonnes in 2010 to 1 million tonnes in 2023. Demand is expected to accelerate through to 2030 increasing to about 3.6 million tonnes.
Semiconductor Chip Shortage: Impact on Electric Vehicles 2020-2029

March 26, 2026
Since the first half of 2020, the auto industry has been facing a systematic decline in production primarily due to the Covid-19 pandemic that heavily impacted manufacturing for a long while and has since contributed to supply chain disruptions of most items, including auto parts. One of the casualties of this has been the crisis in the semiconductor industry, not only from manufacturing and supply chain disruptions, but also stiff competition from home computers as more and more people began working from home.