

Global Natural Gas Supply
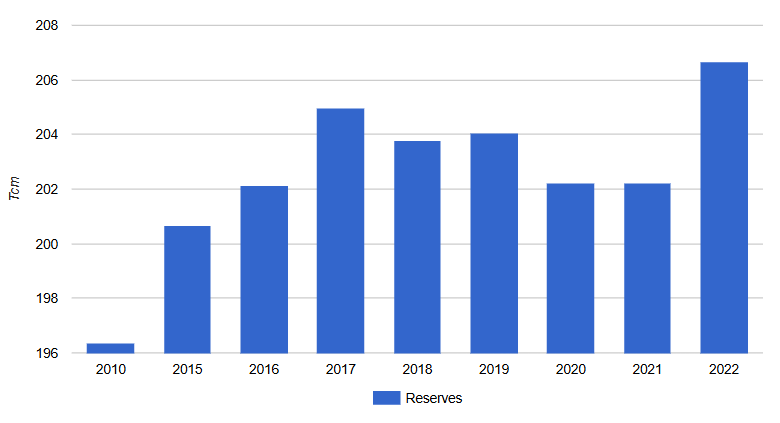
Global Natural Gas Reserves 2010-2022
April 1, 2024
Global natural gas reserves increased from 196 trillion cubic meters (Tcm) in 2010 to 205 Tcm in 2017. Reserves then declined from 2017 through 2020 to about 202 Tcm.
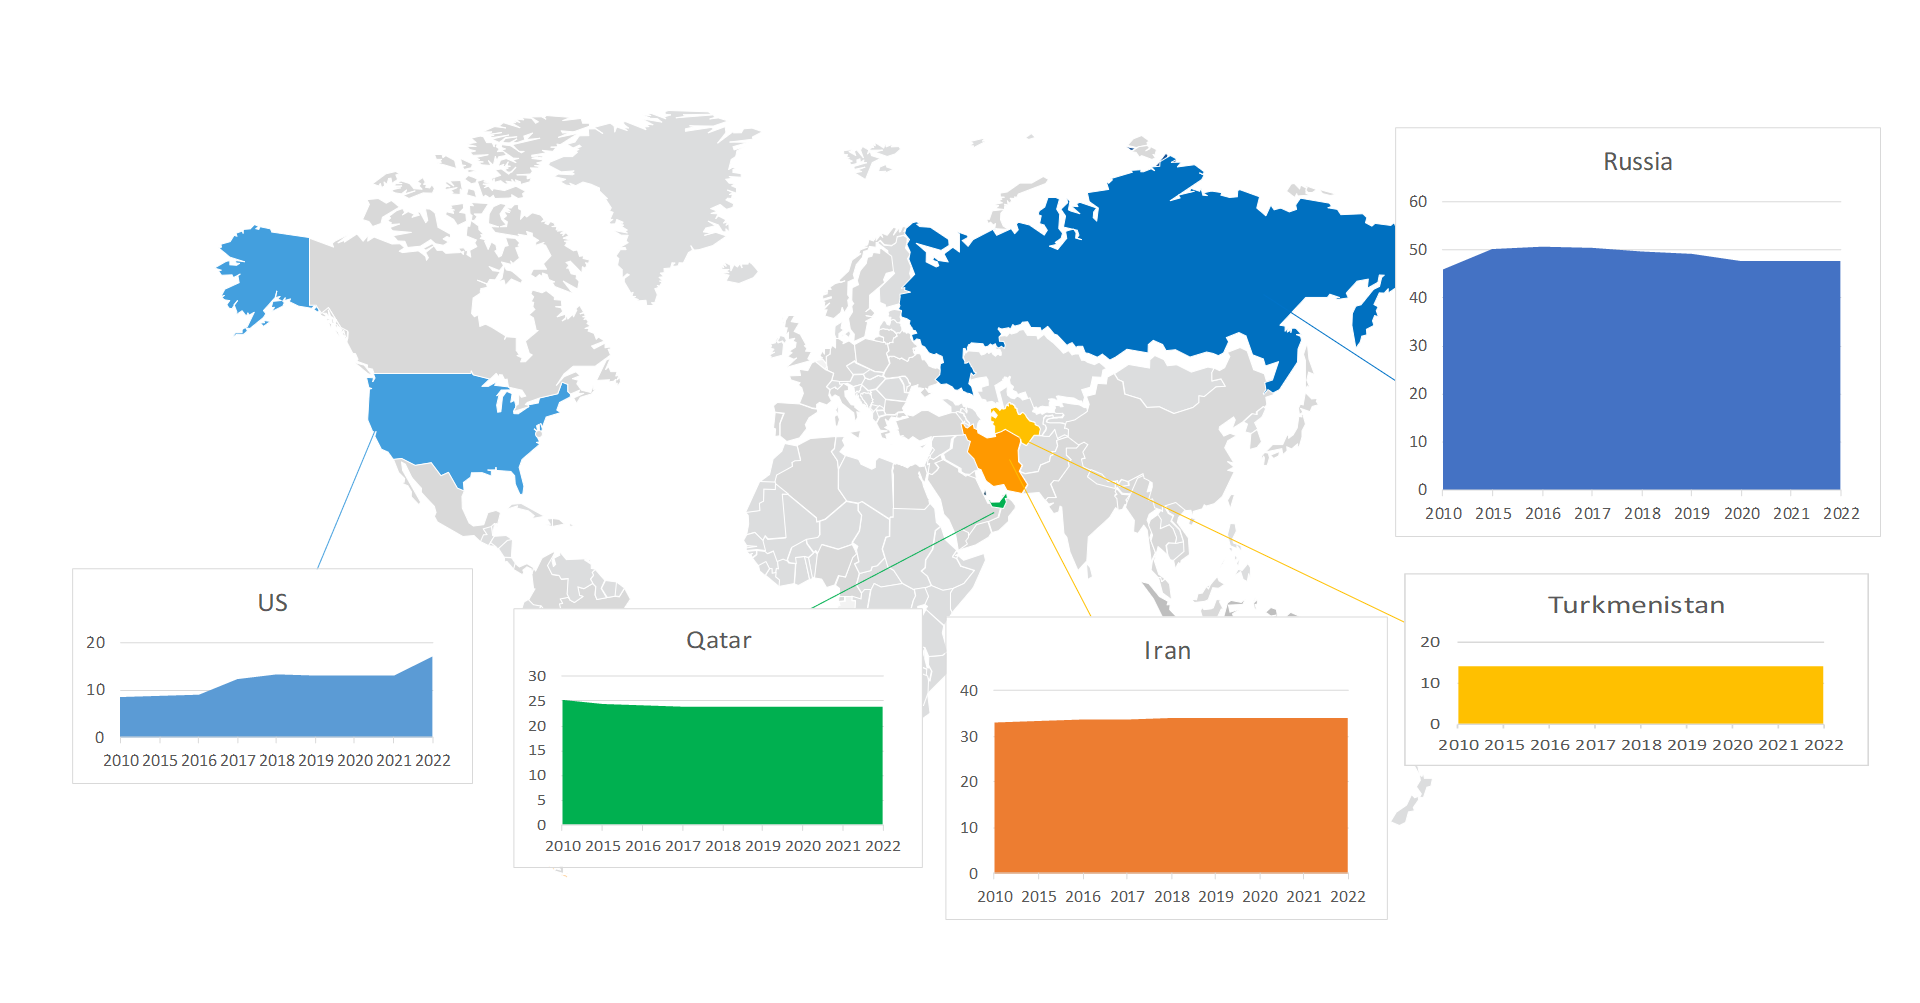
Top 5 Global Natural Gas Reserves By Country 2010-2022 (TCM)
April 1, 2024
In 2022, the top 5 countries totaled 136 Tcm of natural gas reserves and represent about 2/3 of the global total of 206 Tcm.
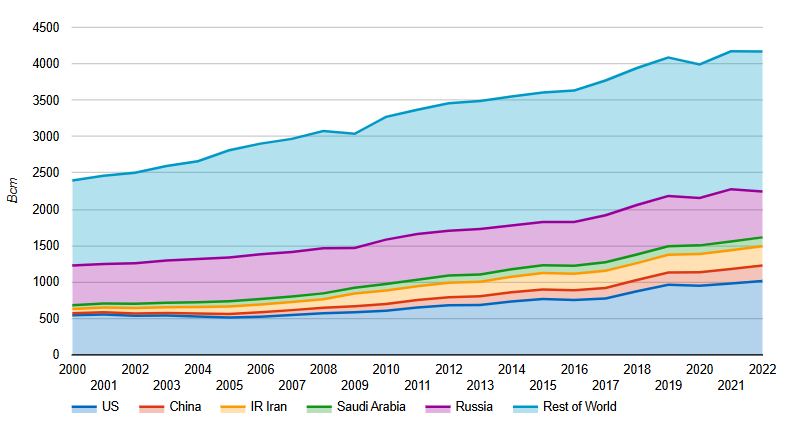
Global Natural Gas Production 2010-2022
April 1, 2024
Global natural gas production has increased 75% since 2010, from 2400 billion cubic meters (Bcm) to about 4200 Bcm in 2022.
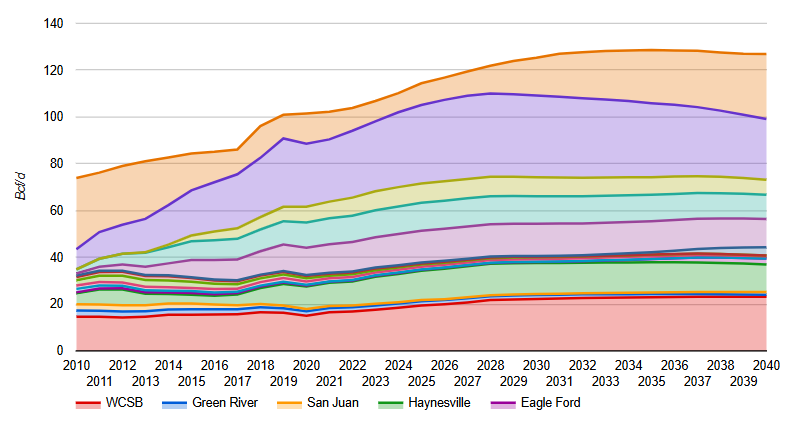
North American Dry Natural Gas Production Forecast
July 5, 2021
Forecast of US and Canadian dry gas production, by area, to 2040.
US production and development is primarily focused in two regions: Appalachia (Marcellus and Utica) and Haynesville while Canada’s is focused primarily in Alberta. Supply growth is driven by forecasted growth in demand from the power generation sector and LNG exports.
US Natural Gas Supply
Largest US Publicly Traded Natural Gas Producers in 2019
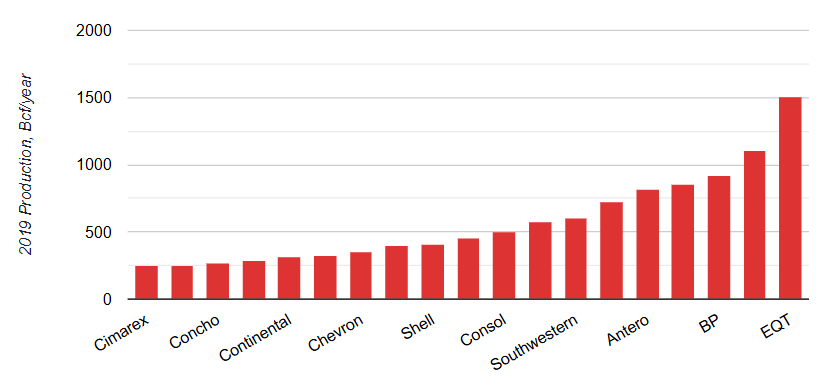
July 19, 2020
Shows the largest US publicly traded natural gas producers in 2019, by production volume (derived from annual reports).
The largest producer is EQT followed by ExxonMobil and BP.
Gas Reserves Life Index for US Companies
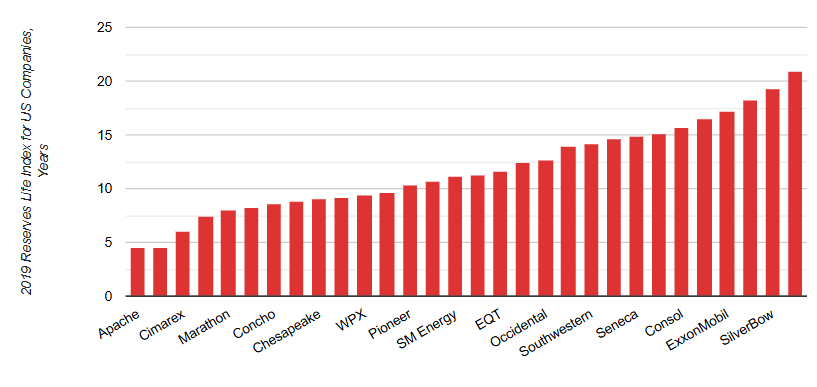
September 16, 2020
The Reserves Life Index (RLI) of the top 30 US natural gas producers shown in years. The RIL is the total proved reserves booked by the largest US companies divided by annual calendar year production.
Range Resources had the highest RLI in the US.
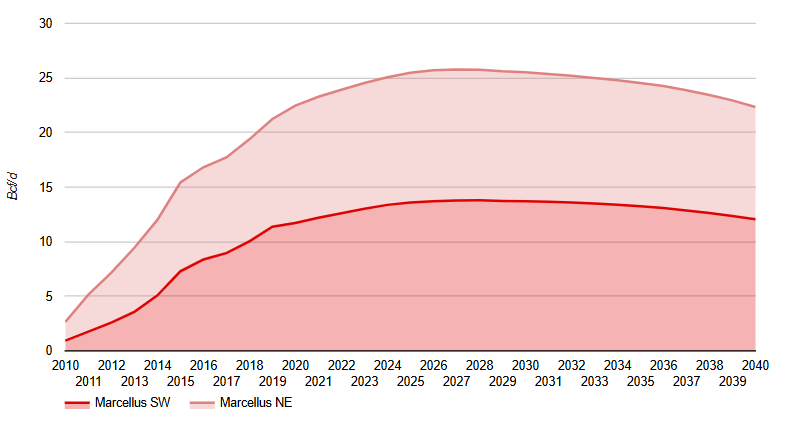
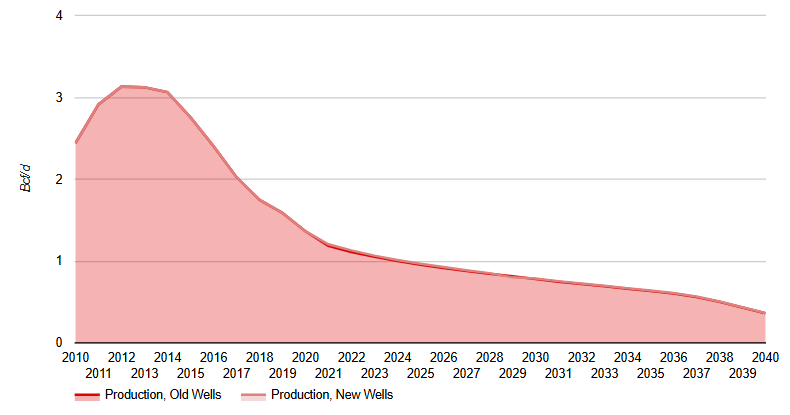
Marcellus SW Raw Gas Production
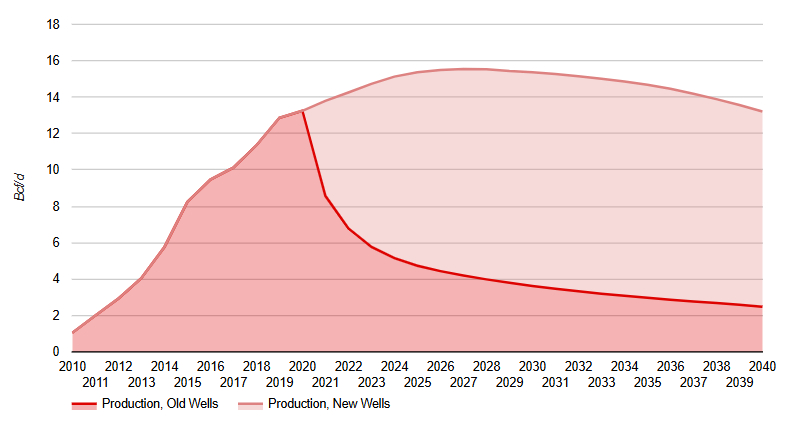
June 29, 2021
Forecast to 2040 of the raw, liquids rich, natural gas production from the Marcellus Southwest (located in southwest Pennsylvania and West Virginia). Additional charts show corresponding initial productivity (IP), well count, and estimated ultimate recovery (EUR).
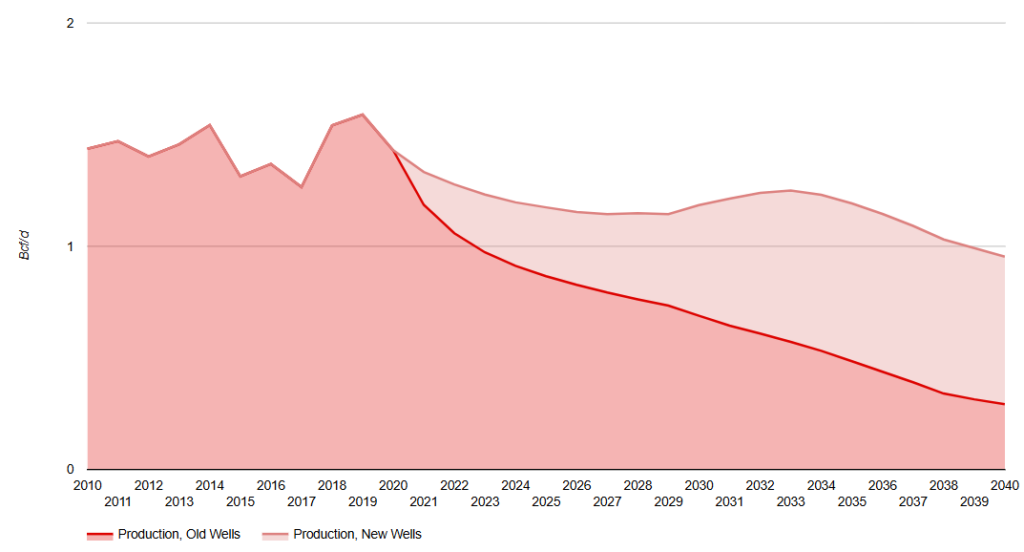
Marcellus NE Raw Gas Production
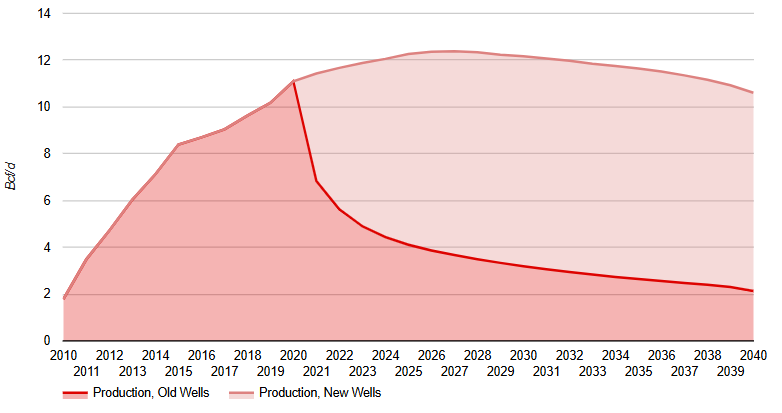
June 29, 2021
Forecast to 2040 of the raw dry gas production from the Marcellus Northeast (located in northeastern Pennsylvania). Additional charts show corresponding initial productivity (IP), well count, and estimated ultimate recovery (EUR).
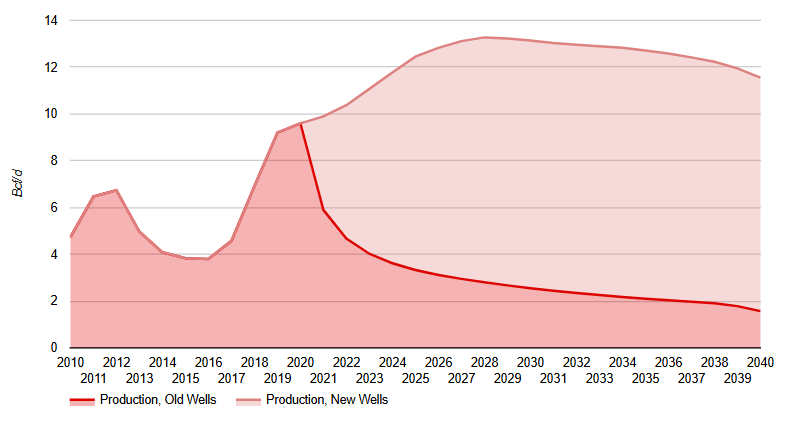
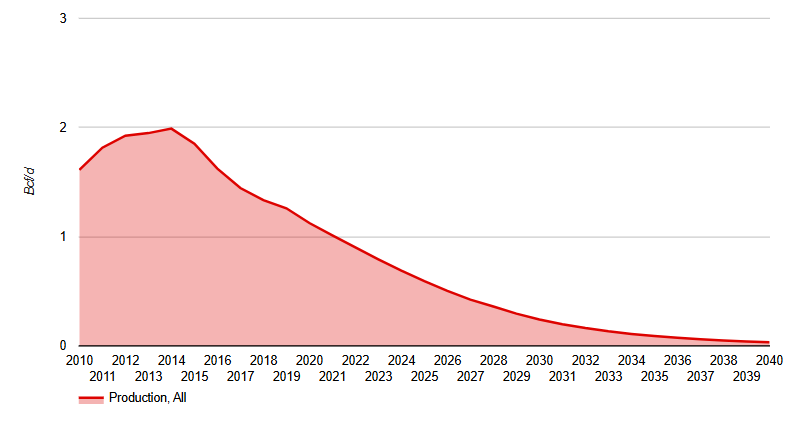
Marcellus Total Dry Gas Production
June 30, 2021
Forecast to 2040 of the total dry natural gas production from the Marcellus region (both the Southwest and Northeast regions). Additional charts show corresponding rig count and a drilling map of the area.
Marcellus is the major producing formation in US. Marcellus SW area produces liquids rich gas, while Marcellus NE production is dry.
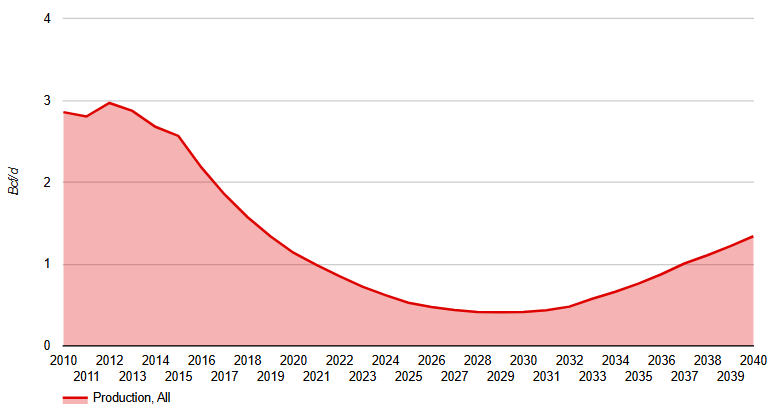
Utica Gas Production
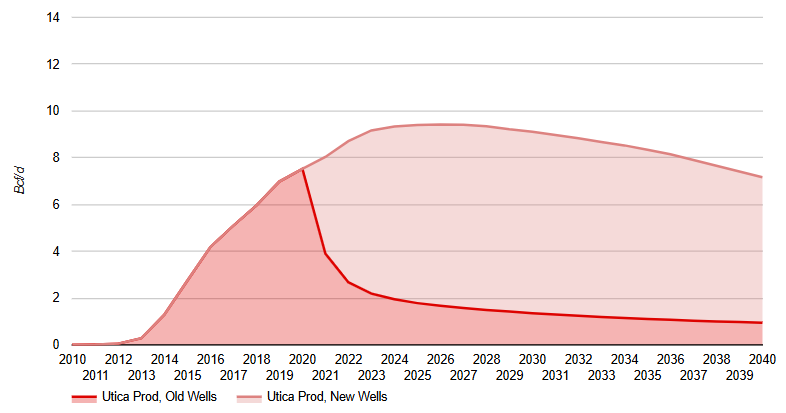
June 30, 2021
Forecast to 2040 of the liquids rich natural gas production from Utica (located in eastern Ohio and southwest Pennsylvania). Additional charts show corresponding initial productivity (IP), well count, estimated ultimate recovery (EUR) and a drilling map of the area.
Utica development began in 2010-2011.
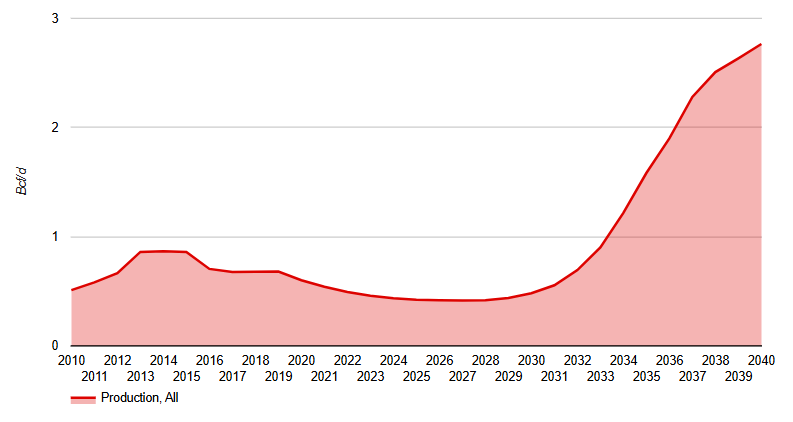
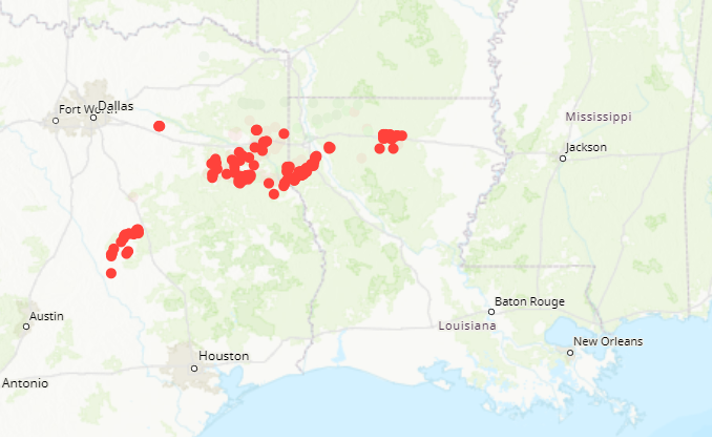
Haynesville Raw Gas Production
July 2, 2021
Forecast to 2040 of the liquids rich natural gas production from Haynesville (located in eastern Texas and northern Indiana). Additional charts show corresponding initial productivity (IP), well count, rig count, estimated ultimate recovery (EUR) and a drilling map of the area.
Haynesville is one of the main producing basins in the US and has one of the lowest production costs due to high initial well productivity.
Green River Raw Gas Production
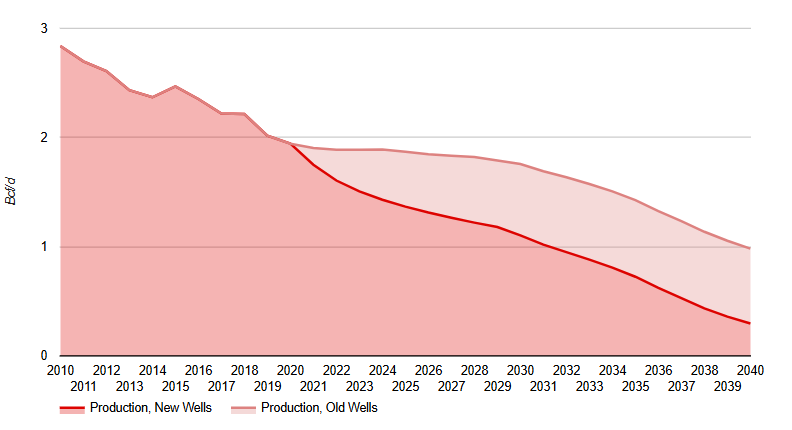
July 2, 2021
Forecast to 2040 of the raw natural gas production from Green River (located in Wyoming and northern Colorado). Additional charts show corresponding initial productivity (IP), well count, estimated ultimate recovery (EUR) and a drilling map of the area.
Active development of tight gas started in 2005, however, development slowed after 2015 when the economics of Green River became less attractive compared to other basins, such as Marcellus and Utica.
Arkoma Raw Gas Production
July 2, 2021
Forecast to 2040 of the raw natural gas production from Arkoma (located in Arkansas and Oklahoma). Additional charts show corresponding initial productivity (IP), well count, rig count, estimated ultimate recovery (EUR) and a drilling map of the area.
Arkoma production was focused on Fayetteville Shale and Woodford Shale, however, both shales are now mature and Incorrys does not expect any further development after 2030.
Anadarko Raw Gas Production
July 5, 2021
Forecast to 2040 of the raw natural gas production from Anadarko (located in Oklahoma, north Texas, and southern Kansas). Additional charts show corresponding initial productivity (IP), well count, estimated ultimate recovery (EUR) and a drilling map of the area.
Anadarko wells drilled towards Granite Wash and Woodford formations have matured while drilling continues in the less productive Mississippian formations. This has led to a significant drop in new well initial productivity.
Barnett Raw Gas Production
July 5, 2021
Forecast to 2040 of the shale gas production from Barnett (located north of Dallas and Ft Worth Texas). Additional drilling map of the area.
Barnett was the first basin to prove horizontal drilling and multistage fracking for shale gas. Barnett consists of a gas area in the south portion of the basin and oil and condensate area in the north portion.
San Juan Raw Gas Production
July 5, 2021
Forecast to 2040 of the natural gas production from San Juan (located in north New Mexico and southern Utah). Additional drilling map of the area.
San Juan is both a conventional and coal bed methane (CBM) basin which currently has no significant development and is in decline. San Juan basin includes Mancos Shale, which Incorrys believes will be developed after 2030.
Eagle Ford (Non-Associated) Gas Production
July 5, 2021
Forecast to 2040 of the liquids rich, non-associated natural gas production from Eagle Ford (located in the southern area of Eagle Ford on the Texas Gulf Coast). Additional drilling map of the area.
Most development is currently focused in the oil portion of the basin. Active gas development is expected when current core acreage in tier 1 Shale basins is exhausted in about 2030.
Permian (Non-Associated) Gas Production
July 5, 2021
Forecast to 2040 of the non-associated natural gas production from the Permian (located in west Texas and eastern New Mexico). Additional drilling map of the area.
Most wells in Permian are classified as oil and produce significant quantities of associated gas, while production from gas wells is currently very limited. Active gas development is expected later in the forecast period as Tier 1 Shale Gas basins and Permian oil production begins to decline.
Gulf of Mexico Offshore Gas Production
July 5, 2021
Forecast to 2040 of the natural gas production from the offshore Gulf of Mexico (located offshore Texas and Louisiana). Additional drilling map of the area.
Current natural gas focused drilling in the Gulf of Mexico is very limited due to the high cost relative to other basins. Incorrys does not expect Gulf of Mexico gas production to recover during the forecast period and is negligible by 2040.
Other Gas Basins and Plays
July 5, 2021
This shows other basins and plays in the US Gulf Coast and Rockies regions.
In the US, Gulf Coast basin is the Travis Peak formation, Bossier formation, and Cotton Valley formation. In the Rockies area, there is Unita, Piceance, Powder River, Paradox, and DJ Niobrara. A brief description of each is provided in the details.
Canadian Natural Gas Supply
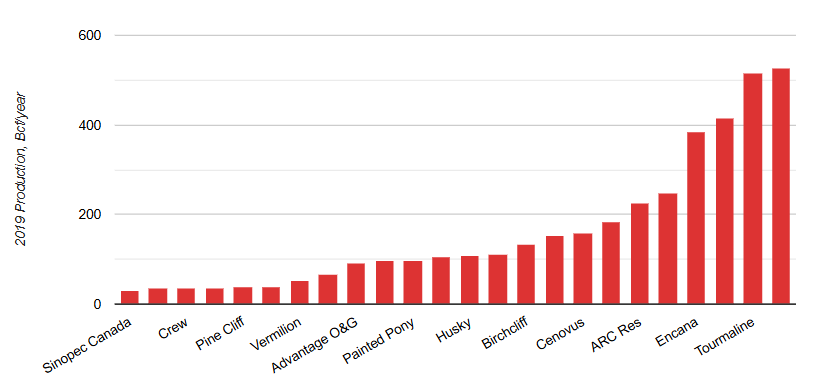
Largest Canadian Publicly Traded Natural Gas Producers in 2019
July 19, 2020
Shows the largest Canadian publicly traded natural gas producers in 2019, by production volume (derived from annual reports).
The largest producer is CNRL followed by Tourmaline and Repsol.
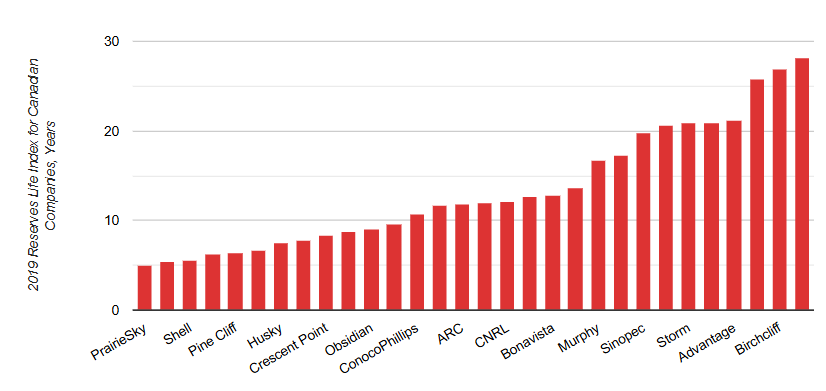
Gas Reserves Life Index for Canadian Companies
September 16, 2020
The Reserves Life Index (RLI) of the top 30 Canadian natural gas producers shown in years. The RIL is the total proved reserves booked by the largest US companies divided by annual calendar year production.
Painted Pony had the highest RLI in Canada (Painted Pony was acquired by Canadian Natural Resources (CNRL) in late 2020).
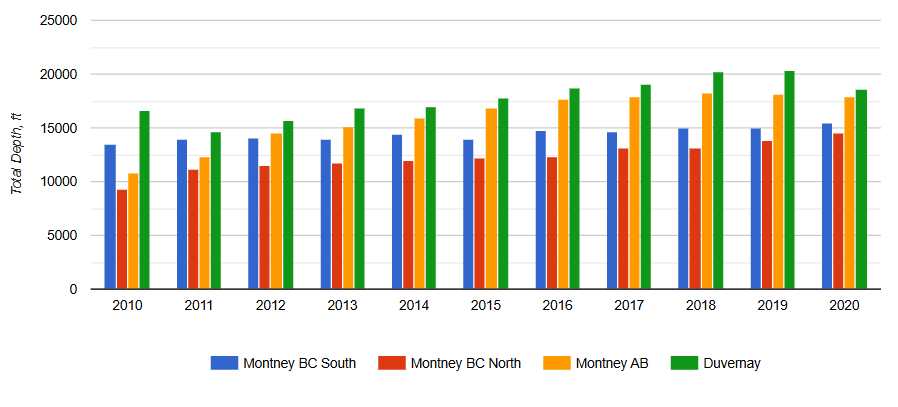
Well Depth in Montney and Duvernay
September 30, 2020
The average total well depth of the Montney and Duvernay plays in Western Canada over the past 10 years.
The growth in total well depth is usually associated with increased length of laterals which should lead to increased well productivity.
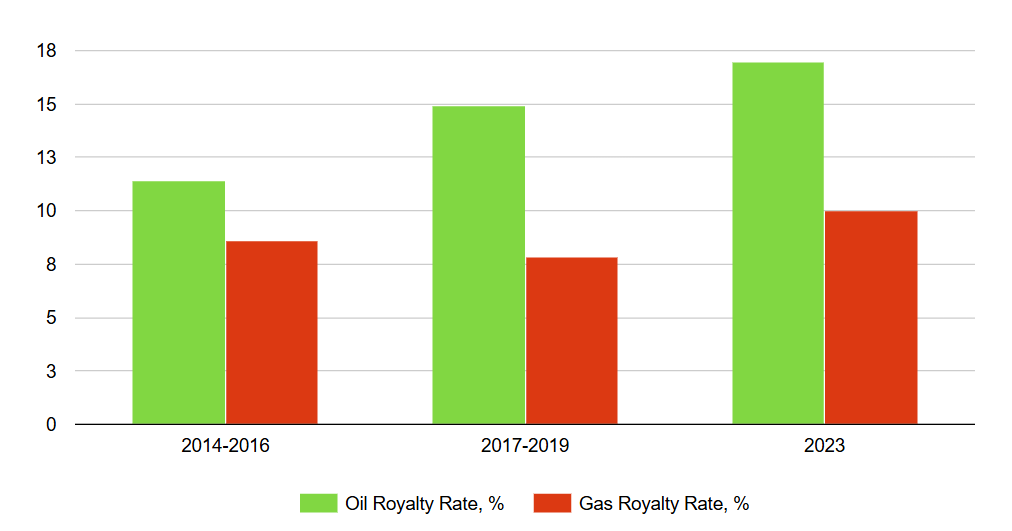
Western Canadian Oil and Gas Royalty Rates
July 24, 2024
In Western Canada, royalties are calculated based on a complex formula, which includes production, oil and gas prices, as well as different incentives. If the price of oil and gas decline, it will lead to a decline in royalty rates, as occurred in 2015 for oil and 2019 for gas.