The Bottleneck for Venezuelan Oil Industry
January 12, 2026
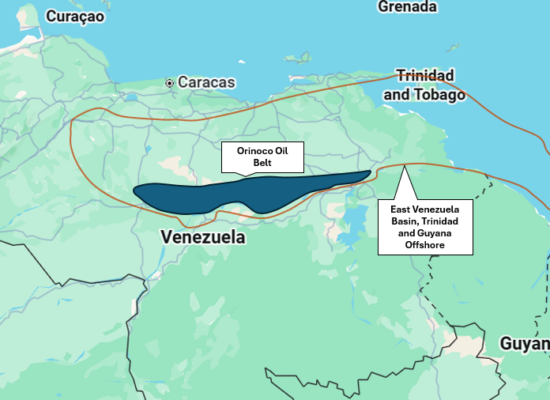
Venezuela produces heavy oil primarily from the Orinoco Oil Belt. This heavy oil requires special methods for production, transportation, and refining. In particular, diluent — a lighter hydrocarbon such as naphtha, condensate, or light crude — must be mixed with heavy oil to reduce its viscosity and allow it to flow. In addition, Venezuelan heavy oil production largely requires steam injection to heat and extract oil from the reservoir. Steam generation, in turn, requires natural gas or oil-based fuel. This raises the question: how is Venezuela addressing these challenges?
Full-Cycle Cost of Venezuelan Oil
January 07, 2026
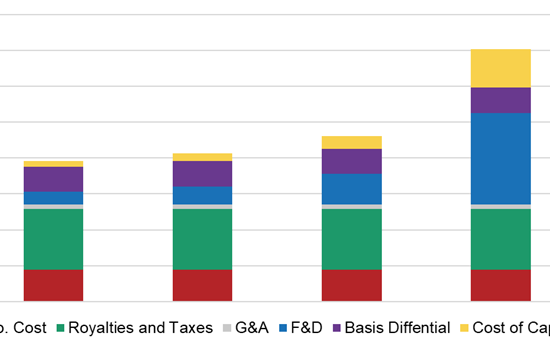
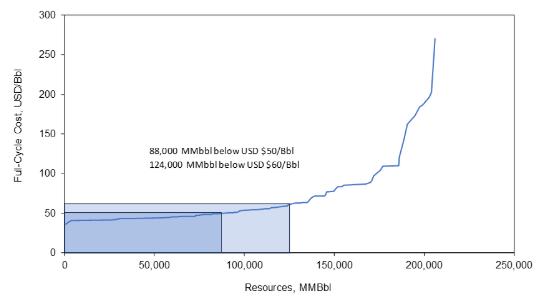
In light of recent events surrounding Venezuela and its oil industry, it is important to assess the cost of Venezuelan oil. Understanding the full-cycle or breakeven cost of oil is critical for assessing the relative competitiveness of different jurisdictions. Capital usually flows to countries and regions with lower costs. The question remains: will producers invest in the exploration, development, and production of Venezuelan oil?
Venezuela Tanker Blockade
December 21, 2025
On December 16, 2025, the United States ordered a “total and complete blockade” of sanctioned oil tankers entering and leaving Venezuela. What does this mean for Venezuela and the global oil industry? Would it cause an oil shortage on world markets? How would it affect Venezuela’s revenues, and what could happen next?
Major Obstacle in New Oil Pipeline Construction: Cost Overruns
December 14, 2025
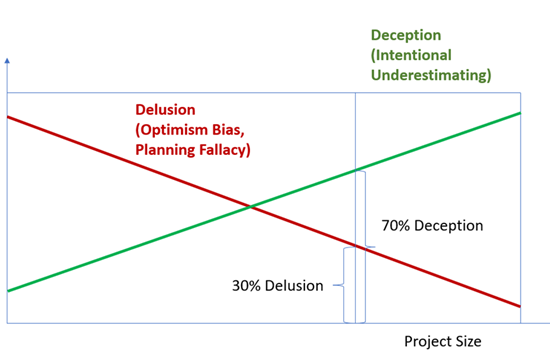
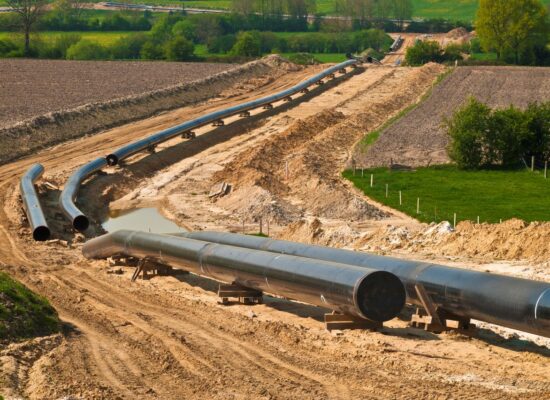
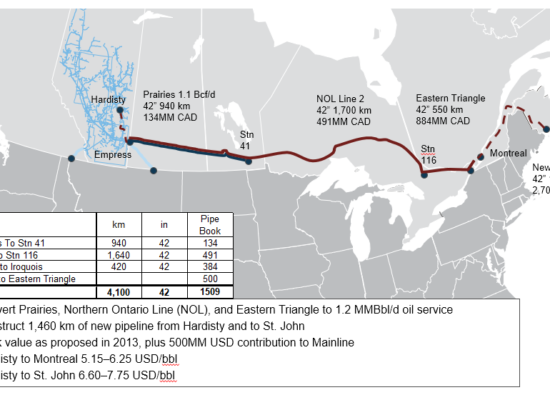
The Memorandum of Understanding between the Canadian federal government and the Province of Alberta, signed on November 27, 2025, mentions a new pipeline expected to bring Alberta’s bitumen to the northern coast of British Columbia. Such a project would face many obstacles. Incorrys believes that one of the critical challenges is the high cost of the project, particularly the risk of significant cost overruns.
Economic Benefits of a New Potential Oil Pipeline to Northern BC
December 05, 2025
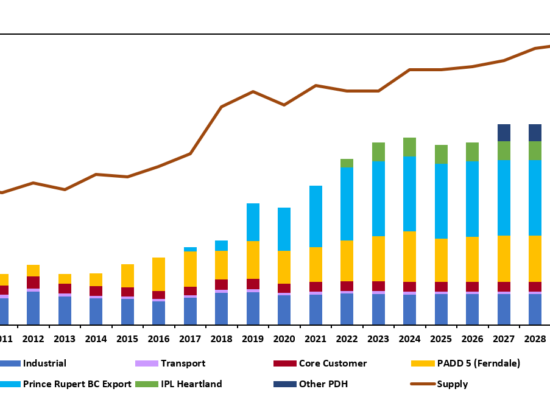
On November 27, 2025, the Canadian federal government and the province of Alberta signed a Memorandum of Understanding focused on developing the energy industry, particularly increasing Canadian oil and gas production. The Memorandum specifically mentions a new pipeline that is expected to bring Alberta’s bitumen to the northern coast of British Columbia. Together with the expansion of the existing Trans Mountain pipeline, the new pipeline could deliver up to 1.4 MMBbl/d of bitumen to buyers in Asia. This would represent roughly a 27% increase in Canadian crude oil production.
US Emissions from Oil and Gas Industry: Current Trends
November 27, 2025
US emissions from oil and gas industry are a small but important share of national greenhouse gases. In 2023, the United States emitted nearly 6.2 billion metric tons of greenhouse gases (CO₂e). Most human-caused emissions – over 70 percent – come from burning fossil fuels. The oil and gas sector accounts for about 0.32 billion metric tons, or roughly 5 percent of total emissions. This figure covers emissions directly from oil and gas production, transportation and processing. It does not include emissions from burning oil and gas by other industries or consumers.
So what are the major sources of emissions in the oil and gas industry, and what are the trends?
Is the Canadian Oil and Gas Industry Reducing Methane Emissions?
November 21, 2025
Methane is a very potent greenhouse gas. It is far more effective at trapping heat than carbon dioxide over shorter timeframes—at least 28 times more heat over a 100-year period. Methane can be emitted during oil and gas development primarily due to equipment leaks, as well as through other sources such as venting. At the same time, reducing methane emissions can be implemented at a relatively low cost compared to other decarbonization technologies. Methane accounted for 117 Mt of CO₂e emissions in 2022, representing over 16 per cent of Canada’s total greenhouse gas emissions. Approximately half of these emissions (56 Mt of CO₂e) come from the oil and gas sector.
Ksi Lisims LNG: Will It Happen?
November 12, 2025
In November 2025, Prime Minister Mark Carney is expected to include Ksi Lisims LNG on the list of new nation-building projects. On September 11, Carney added another West Coast LNG project — Phase Two of LNG Canada in Kitimat, B.C. — to this list. Including projects on that list means that Canadian federal departments will coordinate approvals more closely, reducing bureaucratic delays. While this is good news for Ksi Lisims LNG proponents, it does not necessarily mean the project will eventually be built.
US Sanctions Against Russian Oil Industry and Their Implications
November 07, 2025
Sanctions Against Russian Oil Companies: Do They Work?
At the end of October, the US government sanctioned Russia’s two largest oil producers — Rosneft and Lukoil. Until now, the US had refrained from imposing sanctions on these energy companies. How will this affect Russian oil production, and will it reduce Russia’s war chest?
What Are the Limits on Data Center Growth?
November 02, 2025
Many energy companies in North America, including natural gas producers, are trying to capitalize on the growth of data centers, which require a significant amount of energy to operate. But is this growth sustainable?
Breakeven Cost of Russian Oil Continues to Grow
October 29, 2025
On October 22, 2025, the U.S. government imposed sanctions on the Russian oil industry. The sanctions target Russia’s two largest oil companies: Rosneft and Lukoil. This represents the largest and most consequential set of U.S. sanctions against the Russian oil sector to date. Even before the introduction of these recent sanctions, the Russian oil industry faced a significant but often overlooked problem: cost escalation. Even if oil prices remain stable, rising costs will have a substantial impact on oil revenues.
Data Center Power Consumption
October 24, 2025
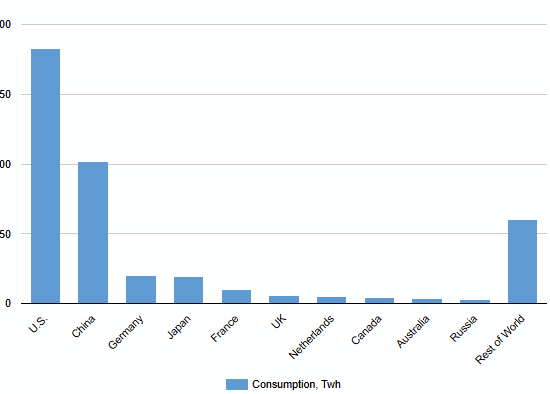
Data centers have shifted from a niche load to a major driver of electricity demand. The three charts that follow trace this shift from different perspectives: a country snapshot for 2024, a regional trajectory through 2030, and a review of various U.S. published outlooks.
Carbon Capture and Storage Cost — Gas Industry
October 23, 2025
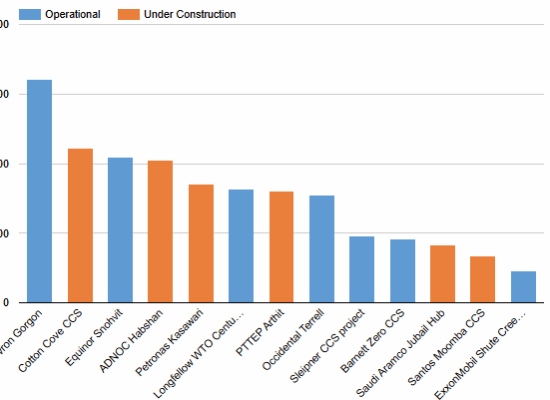
Carbon Capture and Storage (CCS) has become a central component of decarbonization strategies in the natural gas industry. Incorrys review of more CCS facilities related to natural gas production and processing — ranging from early projects such as Occidental’s Terrell plant (1972) to mega-scale facilities like Saudi Aramco’s Jubail Hub (scheduled for 2027). Overall CCS project economics should be analyzed based on multiple factors, including capital expenditures (CAPEX), operating cost, economic benefits such as Enhanced Oil Recovery (EOR), and government incentives. This analysis includes assessment of CAPEX only, which can be served as an input to economic evaluation of CCS project.
Carbon Capture and Storage (CCS) Capacity: World vs Canada
October 20, 2025
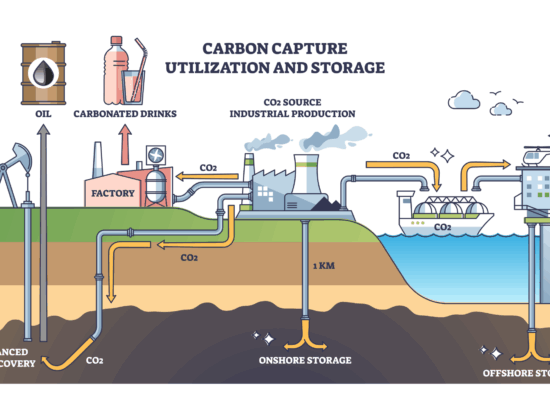
Carbon Capture & Storage technology captures CO2 from industrial sources like power plants, transports it, and permanently stores it deep underground in geological formations such as saline aquifers or depleted oil and gas reservoirs for enhanced oil recovery. As of the end of 2024, global operational CCS capacity is 51 million metric tons of carbon dioxide/year (MtCO₂/yr), with an additional 50+ MtCO₂/yr under construction over the 2025-2027 timeframe. In 2024 Global CO2 emissions from energy combustion and industrial processes were 37,600 MtCO₂/yr thus, current CCS global capacity represents only 0.16% of total emissions.
Chinese Natural Gas Supply & Demand and Potential Role of Canadian LNG
October 15, 2025
Despite the growth of renewable energy and a continued heavy reliance on coal-fired power generation, Incorrys believes China’s need for natural gas must increase significantly to meet growing energy demand going forward. Currently, China utilizes a mix domestic production, pipeline gas, and liquefied natural gas (LNG) to meet their natural gas requirements. Incorrys has examined how their natural gas supply mix might evolve over the next decade, and the potential role Canadian LNG might play.
Ukrainian Attacks on Russian Oil Infrastructure and Their Implications
October 10, 2025
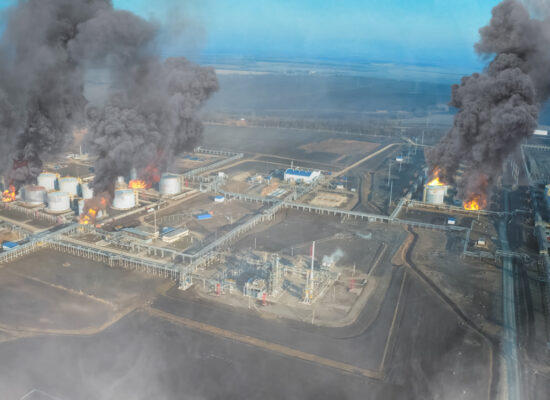
In the last few months, Ukraine has intensified its attacks on Russian oil infrastructure, primarily targeting oil refineries. The attacks began in the spring and summer of 2024, when Ukraine developed drones capable of reaching targets deep inside Russia. By 2025, Ukraine had significantly improved its drone capabilities—they can now fly farther and carry larger payloads. The frequency of drone attacks has also increased substantially. For example, the Volgograd refinery has been hit four times since August, the Novokuibyshev refinery three times, and the Saratov, Ryazan, and Salavat refineries twice each.
The Business Case for Canadian LNG – Part 3
July 7, 2025
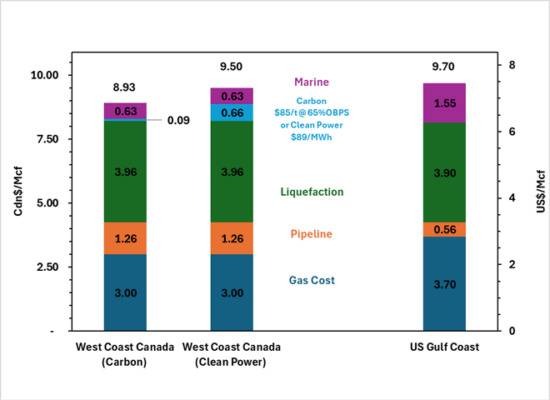
In The Business Case for Canadian LNG – Part 1, we examined the Global carbon emissions treaty frameworks, Canadian legislated emissions targets, and the huge downward impact on global CO2 emissions from Canadian LNG projects. The Business Case for Canadian LNG – Part 2 quantified the cost advantage for Canadian west coast LNG landed into Asia, versus US Gulf Coast (USGC) Projects. We then calculated the impact of current BC and federal net-zero power requirements on new projects. These policies eliminate the Canadian LNG cost advantage and bring untenable power cost risk to BC projects that US projects do not have. In this last Part 3, we look back at the history of LNG liquefaction projects in Canada, and the progression of federal and provincial policies that are the primary impediment to new large-scale development: Killing the Golden Goose.
North American Natural Gas Resources
June 18, 2025
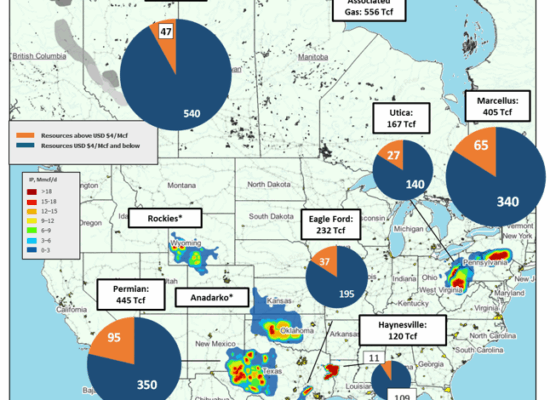
Incorrys recently completed a comprehensive analysis of North American Natural Gas supply, and corresponding breakeven costs, for major onshore basins in the US and Canada. Incorrys determined the amount of natural gas resource remaining in the major North America natural gas supply basins, at breakeven costs at or below USD $4/Mcf and greater than USD $4/Mcf.
North American Natural Gas Breakeven Cost by Basin
April 30, 2025
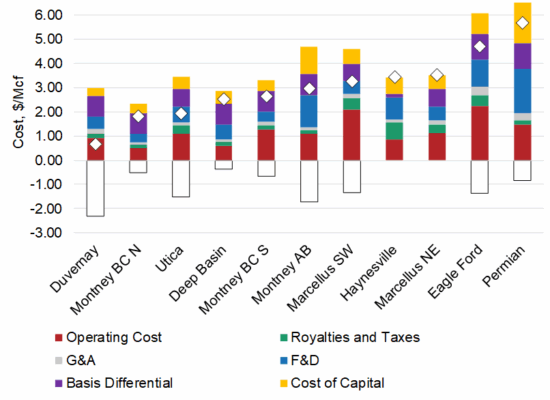
Incorrys prepared a comprehensive analysis of North American natural gas full cycle costs (Q1 2022 through Q3 2024) for all major producing basins in both the US and Canada. In a market with intense competition for Capex and return on investment (ROI), full cycle costs are a crucial tool to compare investment opportunities. Full cycle costs in this analysis include an uplift from sale of liquids produced. Duvernay has the lowest fully cycle cost at just USD $0.67/Mcf due to having the highest liquids uplift at $2.31/Mcf. However, Duvernay has limited resources in liquid rich and superrich areas compared to other basins.
The Business Case for Canadian LNG – Part 2
April 23, 2025
In our LNG Business Case – Part 1, we discussed the global GHG emissions reduction framework and treaties, and the outsized role of Canadian LNG as a viable and feasible solution to lower Global CO2 emissions. In this Part 2, we examine the competitive economics for west coast Canada LNG. As we will demonstrate, the economics are in west coast BC’s favour when compared to US Gulf Coast (USGC) Projects. It is only after costs associated with made-in-Canada legislation and policies are included, that major LNG Projects, on the scale of LNG Canada, are challenged.
Canadian Streel and Energy Tariffs
March 1, 2025
US President Donald Trump’s tariff threats on Canadian Steel and Energy arbitrarily disregard the re-worked USMCA (also referred to as CUSMA) free trade agreement, set for renewal in 2026. Incorrys believes that a possible solution to support the Canadian steel industry would be to build a Canadian east-west pipeline. If the government wishes to support Canadian steel and jobs, perhaps building infrastructure is a better investment than mere handouts. Simply rebooting the Northern Gateway Pipeline Project (NEB approved in 2013 and subsequently denied by the current Liberal Government Cabinet) could add demand for ~400,000 tonnes of steel, and once built, would decrease reliance on US markets for steel and crude exports and add much needed construction and manufacturing jobs.
US Dry Gas Production Forecast to 2040
February 22, 2025
Incorrys undertook a comprehensive, well-by-well and basin-by-basin analysis of raw natural gas production, which helped form the basis of our outlook for US dry gas production to 2040. This analysis indicates the US has almost 1100 trillion cubic feet (Tcf) of natural gas resources with full cycle costs less than USD$4/Mcf. Due to this ample endowment, there are no constraints on supply, meaning that natural gas production to 2040 will respond to meet growing US demand. US dry natural gas production grew from about 59 billion cubic feet per day (Bcf/d) in 2010 to almost 92 Bcf/d in 2023. Incorrys projects gas production to increase 29% through 2040, reaching almost 120 Bcf/d.
North American Oil Resource Cost Curve
November 26, 2024
Incorrys examined the North American Oil Full-Cycle Costs by basin and cost category, these are all of the costs associated with finding and producing the oil, a key factor used by producers (among others) for corporate planning, risk management, and various other purposes. Incorrys combined all of these results to produce a resource cost curve that shows the potential amount of oil and lease condensate resource available at varying price levels. North American oil full-cycle cost curve, in USD/Bbl at the West Texas Intermediate benchmark price, shows that there are 88 billion barrels of oil with a full-cycle cost less than $50/Bbl and 124 billion barrels at or below $60.
Should Alberta Join Team Canada?
November 26, 2024
US President-elect Donald Trump has warned the Canadian Federal Government that the US will impose a 25% tariff on all Canadian imports unless Canada ensures border security, among other things. With this in mind, what does Team Canada really mean? Will it truly be Team Canada? Or Team Ontario and Quebec? There are rumblings that any Team Canada negotiations could sacrifice Alberta energy exports in order to protect such sectors as Quebec Aluminum and Ontario Auto exports. Will Alberta energy be the sacrificial lamb for these Quebec and Ontario sectors?
North American Oil Full Cycle Cost Breakdown by Basin
November 26, 2024
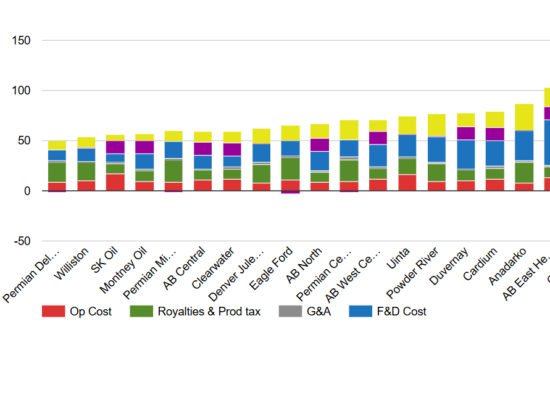
Incorrys prepared a comprehensive analysis of North American crude oil and lease condensate full cycle costs (Q1 2022 through Q3 2024) for all major producing basins in the US and Canada (excluding oil sands). Full cycle costs are comprised of six major components: Finding & Development, Cost of Capital, Operating Cost, Royalties & Production Taxes, General and Administrative, and Basis Differential. Permian Delaware has the lowest full cycle cost of all basins in North America and the only one under USD $50/Bbl.
US Raw Associated Gas Production Forecast
October 23, 2024
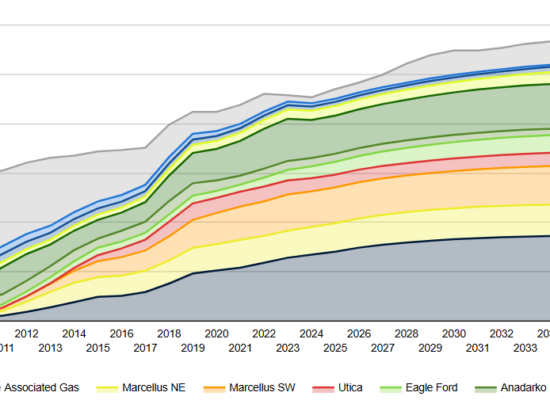
US associated gas production, in select basins, grew over 25% annually from just 1.5 Bcf/d in 2010 to 28 Bcf/d in 2023, driven primarily by the increase in the gas/oil ratios within tight oil basins. In 2023, the Permian basin, located in west Texas and southeast New Mexico, was the largest producer of associated gas accounting for two-thirds of the total, or 18 Bcf/d; not unexpected since the Permian basin is also the largest oil producing region in the US.
US Crude Oil & Lease Condensate Forecast
September 24, 2024
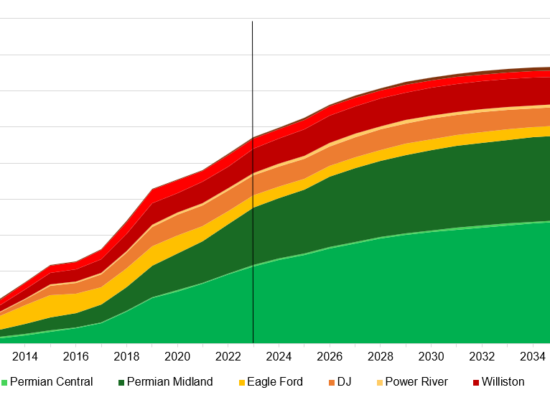
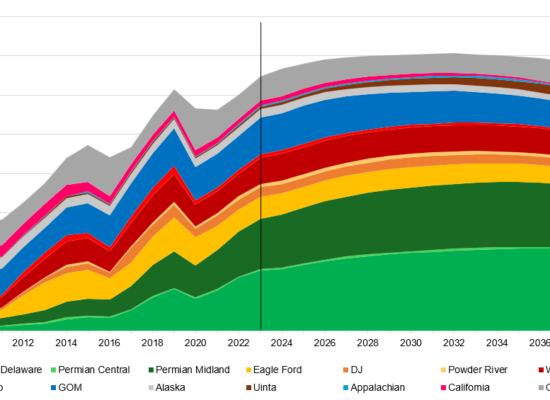
Total US crude oil and lease condensate production increased over 130% between 2010 and 2023, from 5.5 million barrels/day (MMBbl/d) to almost 13.0 MMBbl/d, coinciding with the shale “boom” that altered oil market dynamics. In 2023, almost 64% of US Crude oil production came from Tight Oil basins: Permian, Eagle Ford, DJ and Power River Niobrara, and Williston. Looking ahead, US crude oil and lease condensate production is expected to continue to grow and peak at just over 14,000 MBbl/d by 2032. It remains flat until 2034 and then begins to decline, dropping back to 2023 levels by 2040, due to the maturity of Tight Oil basins.
Alberta Oil Sands Production Forecast by Type
August 20, 2024
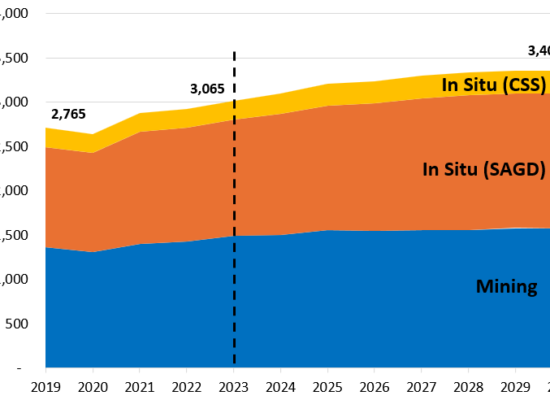
The Alberta oil sands is one of the largest oil deposits on earth with reserves estimated to be around 165 billion barrels. Coupled with conventional oil reserves, Canada ranks 3rd largest in the world in terms of oil reserves. Incorrys forecasts oil sands (mining and in situ (SAGD and CSS)) to grow to slow from 2.6% annually (2019-2023) to 1.5% annually to 2030 increasing from about 3.1 million barrels per day (MMBbl/d) to 3.4 MMBbl/d. This represents nearly 80% of total Canadian oil production in 2030.
Capital Cost of Power Generation by Source
August 8, 2024
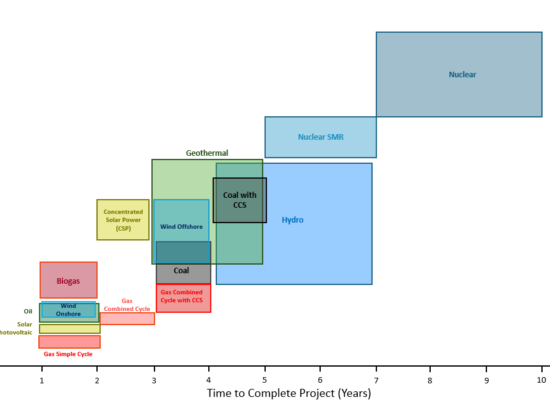
The capital cost of power generation, on a USD/kilowatt of capacity basis, varies significantly based on the technology used, time to complete the project, and capital cost of the project. Incorrys analyzed these variables for each type of power generation to determine a range of costs (USD/kW) and corresponding timeline (years) and provides reasons behind the differences. Natural gas simple cycle plants have the lowest cost ($700-$900/kW) and one of the shortest timelines to complete (1-2 years). Solar photovoltaic systems ($800-$1,000/kW) and onshore wind projects ($1,200-$1,500/kW) are also among the lower-cost options while traditional nuclear power plants ($6,000-$8,000 per kW) are among the most expensive and can take 7-10 years to build.
Global Electricity Generation by Energy Source 2010-2030
July 23, 2024
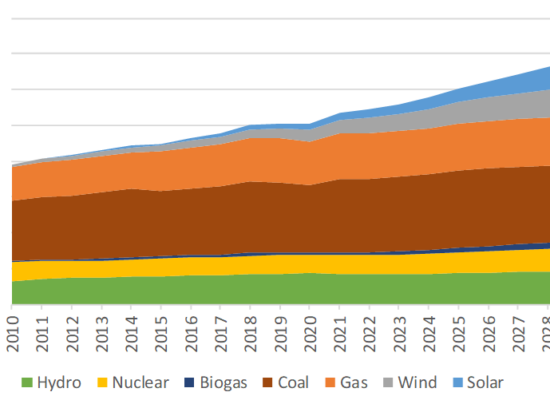
As the global shift towards sustainable energy intensifies, it is essential to understand the evolving landscape of electric power generation. Incorrys projections foresee a significant transformation in the electric power generation mix over the next seven years to 2030. Total global power generation from all sources grew at an average annual rate of 2.8% between 2010 and 2022 from under 20,000 TWh to over 27,000 TWh. Incorrys expects total generation to grow at a robust 3.3% annually through 2030 reaching 35,000 TWh.
Global Natural Gas Power Generation Forecast 2022-2030
May 27, 2024
Natural gas use in power generation is expected to continue to grow, albeit at a much slower pace than the 4% annual average seen from 2000 through 2022. While the need to address climate change has put pressure on all fossil fuel generation, coal in particular, natural gas is expected to play a crucial role in the energy transition through 2030, at least. Clean electricity is expected to gain momentum by 2030, after which the share of natural gas power generation is expected to begin declining. Incorrys expects gas-fired power generation to continue to grow through 2030 at an average annual rate of about 1%, considerably lower than historical rates, from about 6300 TWh in 2022 to almost 7000 TWh in 2030 – 2000 TWh over the IEA Net Zero Emissions scenario.
Global Greenhouse Gas (GHG) Emissions
May 7, 2024
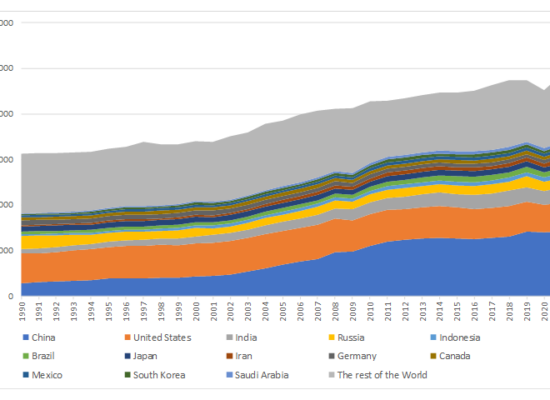
In the years since the Paris Agreement on Climate Change was ratified (2016), while many regions are working towards, or even exceeding the climate goal, others have fallen behind such that Incorrys does not expect the ultimate target to be attainable. Globally, GHG emissions have been growing steadily for many years with the growth rate accelerating since the turn of the century, reaching a record high of over 48,000 million tons (mtpa) of CO2 equivalent (CO2e) in 2019. Despite the 4% decline in 2020, driven mainly by the Covid pandemic, emissions continued the upward trajectory through 2022 peaking at almost 50 mtpa of CO2e. Since 1990, global GHG emissions have increased by 50% and are up 10% since the Paris Agreement was ratified.
The Business Case for Canadian LNG – Part 1
April 11, 2024
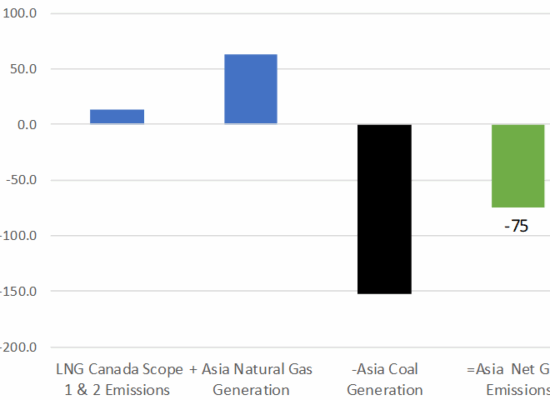
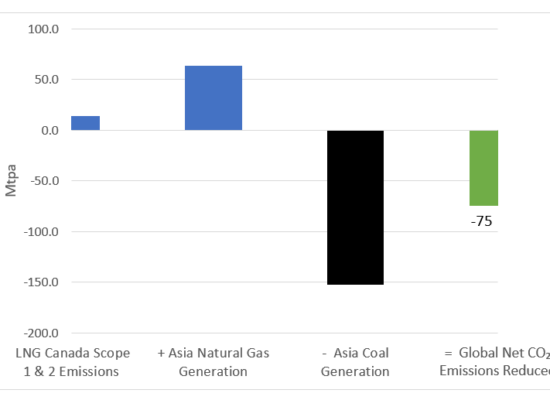
Natural gas power generation has a significantly lower CO2 emissions intensity than coal-fired power. Further, Canada also has lower ambient temperatures than most other LNG producing jurisdictions resulting in much lower CO2 emissions intensity than competing LNG projects in Australia, the US Gulf Coast (USGC) and Qatar. Incorrys analyzed LNG Canada’s 3.2 Bcf/d of gas exports, and their net impact on global GHG emissions, if used to displace coal-fired power generation in Asia. For the LNG Canada project alone, which is due to come online in 2025, Incorrys forecasts a minimum net reduction in global GHG emissions of 75 mtpa of CO2e.
Copper for BEV Batteries 2010-2030
March 26, 2024
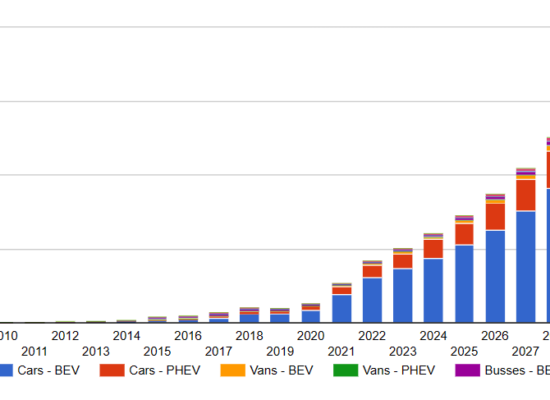
Copper, a symbolic metal with a rich history, is becoming a key player in the modern era of electric vehicles (EVs), where clean energy and sustainability play a crucial role. EVs, aimed at reducing carbon emissions and utilizing energy efficiently, are creating a new demand for copper, especially in the electrical systems of transportation. Incorrys believes that there will be sufficient copper supply to 2030 to satisfy demand for electrical vehicles worldwide. However, there is a significant longer-term uncertainty on copper supply for the burgeoning electric vehicle market; partly due to demand requirements from the other sectors, but also the potential impacts given the politically instability in several large, copper producing regions.
Coal Power Capacity Forecast 2022-2030
March 14, 2024
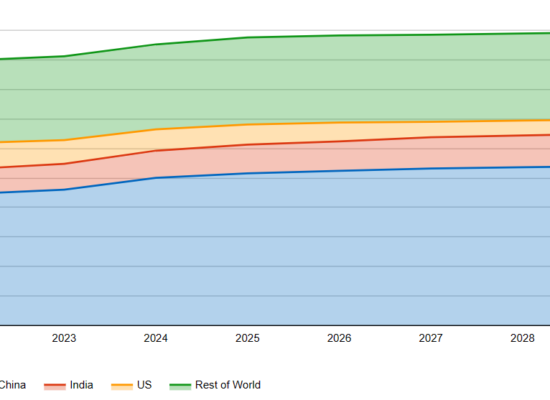
Coal-fired power generation is by far the largest source of electricity generation worldwide unfortunately, it is also the largest greenhouse gas emitter, both overall and on a TWh basis. Unfortunately, as western industrialized countries reduce their use of coal in power generation, some regions, specifically China and India, continue to increase capacity such that they are partially offsetting global efforts to reduce the use of coal and associated carbon emissions. Incorrys forecasts a slight increase in global coal generating capacity through 2030 of about 10% in total, from 2250 GW in 2022 to almost 2500 GW in 2030, most of which is expected to occur by 2025 as many projects in China are currently under construction.
Will Coastal GasLink Natural Gas Pipeline be Expanded?
February 22, 2024
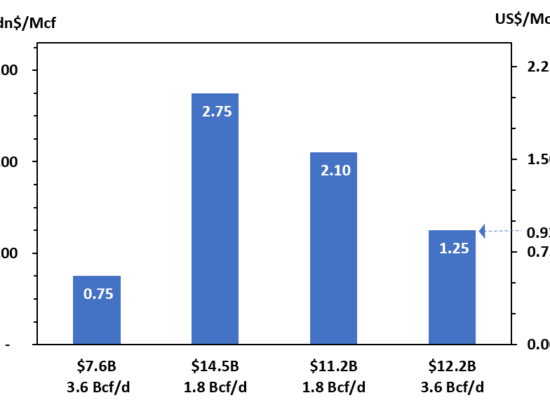
Coastal GasLink (CGL) is a natural gas pipeline project in Canada transporting natural gas from the Montney gas play in northeastern British Columbia to the LNG Canada export facility near Kitimat on the coast of British Columbia. The CGL provides natural gas feedstock to LNG Canada’s liquefied natural gas export terminal, with capacity adequate for two phases of development, consisting of two 900 MMcf/d liquefaction trains in each phase. With the cost to build CGL more than doubling from an initial estimate of Cdn$6.6 billion, Incorrys provides a forecast of CGL pipeline tolls at various cost and throughput levels using our proprietary pipeline tolling model.
Global Refined Lithium Production and Forecast
February 1, 2024
The booming electric vehicle (EV) industry has sparked concerns about whether lithium production can keep up with the escalating demand. Incorrys is forecasting supply to increase over 10% to 145,000 tonnes in 2023 indicating industry efforts to meet the mounting demand. Incorrys expects that by 2030, the supply of lithium will nearly triple to almost 360,000 tonnes.
Hydropower Capacity Forecast 2022-2030
January 24, 2024
Hydropower is one of the oldest, largest, and most reliable sources of renewable energy and is larger than all other renewables combined (wind, solar, bioenergy and geothermal), although it is losing market share as growth in wind and solar generation expands. Annual growth of hydropower capacity is expected to be rather moderate at about 2% (30-40GW) annually growing from about 1400 GW in 2022 to over 1600 GW by 2030.
Global Liquefaction Capacity Growth 2022-28
January 9, 2024
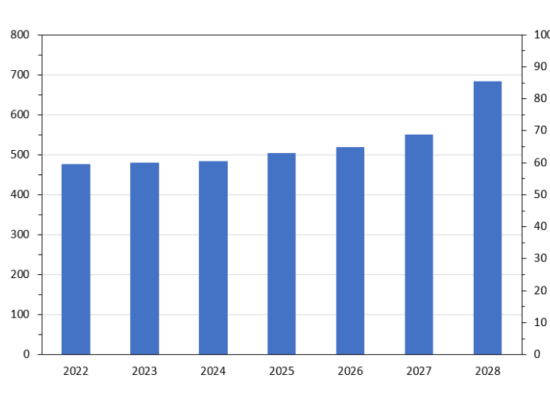
The global Liquified Natural Gas (LNG) market experienced a turbulent year in 2022. The market upheaval caused by the Russia/Ukraine conflict has stimulated significant interest in liquefaction and regasification facilities as markets seek to re-establish energy security priorities. In total, global liquefaction capacity is expected to reach almost 685 mtpa (about 90 Bcf/d of natural gas) in 2028, up over 200 mtpa (~40%) from the 475 mtpa recorded in 2022.
Biogas Power Capacity Forecast 2022-2030
September 26, 2023
Biogas is a gaseous renewable energy source produced from raw materials such as agricultural waste, manure, municipal waste, plant material. Biomethane, on the other hand, is upgraded biogas to near pure methane. Combined, these two renewable energy sources only account for about 5% of the total bioenergy market and well under 1% of global primary energy. However, biogas use for electric generation has grown significantly over the past dozen years in many countries, including Germany, China, and India, from under 10 GW of capacity in 2010 to 25 GW last year.
Wind Power Capacity Forecast 2022-2030
August 16, 2023
Growth in wind power generation, like solar, is being driven by climate change and the need to reduce greenhouse gas emissions. The wind industry has grown significantly since 2010 and, although that growth slowed over the past couple of years due to the challenging economic environment and global supply chain disruptions, it is expected to return to a growth pattern as these issues ease. Incorrys expects global wind power capacity will break the 1 TW mark sometime in 2023 and will approach the 2 TW range by 2030.
Solar Power Capacity Forecast 2022-2030
July 10, 2023
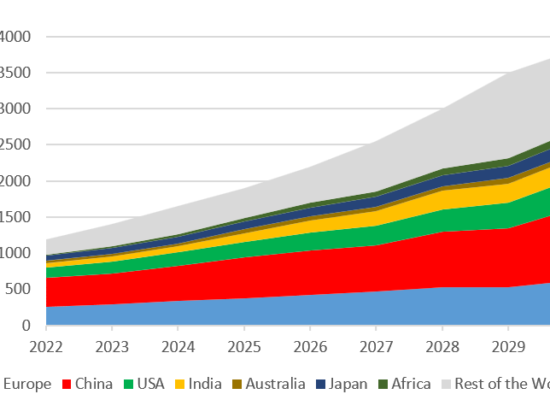
Driven primarily by climate change and the push for renewable energy, solar photovoltaics (PV) was a fast-growing market even before recent events that have brought energy security to the forefront. Solar PV capacity increased from just 6 GW in 2008 to almost 1200 GW in 2022. Since 2022, growth in the solar industry has accelerated as countries increase their investments in the industry. Incorrys expects solar capacity to more than triple from about 1200 GW in 2022 to 3800 GW in 2030.
Canadian Renewable Diesel Demand
June 1, 2023
To meet government mandates for lower CI fuels, more renewable diesel will be required to be blended going forward. How much will depend on the overall requirements for diesel, which is a function of overall vehicle stock. Diesel demand in Canada stagnates through the 2020-2035 period as the electric vehicle market cuts into light duty diesel demand. However, diesel vehicles have a specific niche which make them less susceptible to competition from the EV segment. As such, diesel demand will decline at a slower rate than gasoline vehicles.
Canadian Renewable Diesel Feedstock
May 27, 2023
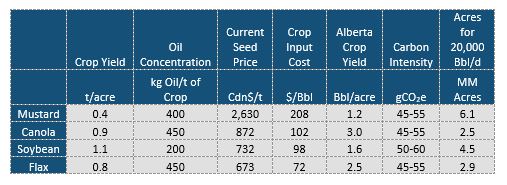
The Canadian Clean Fuel Standard (CFS) is a regulation established by the Canadian government to reduce carbon intensity (CI) within transportation fuels. One of the ways to achieve this CI reduction is through the adoption of renewable diesel. While biodiesel can offer lower CI compared to traditional diesel fuel, its cost-effectiveness depends on factors such as the cost of production, feedstock prices, transportation costs, and tax incentives. Incorrys believes the most important factor is the cost of the feedstock used to produce the biodiesel.
Small Modular Reactors (SMRs)
May 10, 2023
The push to decarbonize global economies and boost energy independence has resulted in renewed interest in nuclear power generation, which has led to the development of new technologies in the nuclear power industry; most notably, Small Modular Reactors (SMRs). The potential advantages of SMRs over traditional nuclear facilities are numerous however, the magnitude of these benefits has yet to be proven due to the lack of development to date. Incorrys expects total SMR annual capacity additions will total over 2100 MW by 2030.
Semiconductor Chip Shortage: Impact on Electric Vehicles
March 24, 2023
Since the first half of 2020, the auto industry has been facing a systematic decline in production primarily due to the Covid-19 pandemic that heavily impacted manufacturing for a long while and has since contributed to supply chain disruptions of most items, including auto parts. One of the casualties of this has been the crisis in the semiconductor industry, not only from manufacturing and supply chain disruptions, but also stiff competition from home computers as more and more people began working from home. Semiconductor chip usage is 10 times greater in EVs than in gas powered cars (3000 chips\vehicle vs. 300 chips in a gas powered vehicle like the Ford Focus).
Battery Electric Vehicles (BEV) Retail Price Trend
February 22, 2023
The 2023 estimated average price of currently available vehicles is USD $72,600 (excluding some of the very expensive models); this compares to Incorrys 2021 estimated average price of USD $70,360. Prices of BEVs, adjusted for inflation, have remained relatively flat over the last 3 years despite efforts to reduce the cost of batteries (the most expensive component of the electric vehicle). The global car industry is still in the process of transitioning toward EVs which is expected to take at least another 5-7 years. However, the price of EVs relative to those of gasoline vehicles are expected to decrease after 2024-2025, while battery capacity will continue to grow. Overall, customers now have a greater variety of BEV models to choose from ranging from more affordable to luxury.
How Russian Oil Revenue Affects the Russian Federal Budget
December 15, 2022
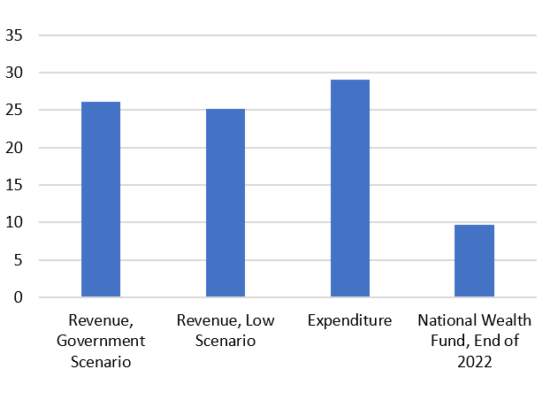
The Russian budget depends very heavily on revenue from the energy sector; particularly from oil and gas. Of the total 2023 Russian federal budget revenue of 26 trillion rubles, 34% is expected to come from the energy sector. The Russian deficit, according to their 2023 budget, is expected to be around 3 trillion rubles – an optimistic scenario. The budget deficit will be financed from the both the National Wealth Fund, which was 9-10 trillion rubles at the end of 2022, as well as borrowing on the domestic market. Although the National Wealth Fund will be sufficient to finance the Russian economy and war efforts in 2023, and perhaps longer, the financial stability of Russia remains uncertain.
Russian Oil Production Forecast
December 15, 2022
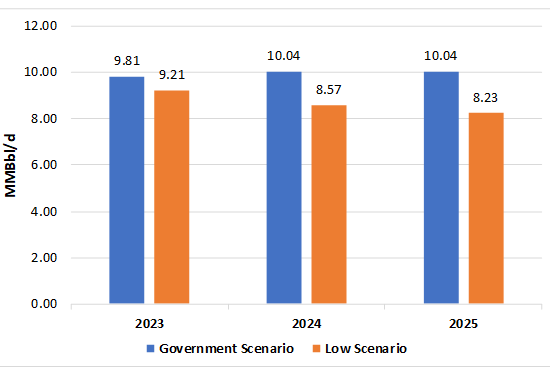
Incorrys expects limited decline in Russian supply in next 1 – 1.5 years and Russia will remain one of worlds largest oil exporters. Due to the financial issues facing Russia (from sanctions, the cost of the war on Ukraine and inability to access capital in western markets) coupled with the lack of new western technologies, Incorrys expects Russian oil production will decrease significantly over the coming years as little to no new development is expected to occur.
What is the Cost of Russian Oil?
October 27, 2022
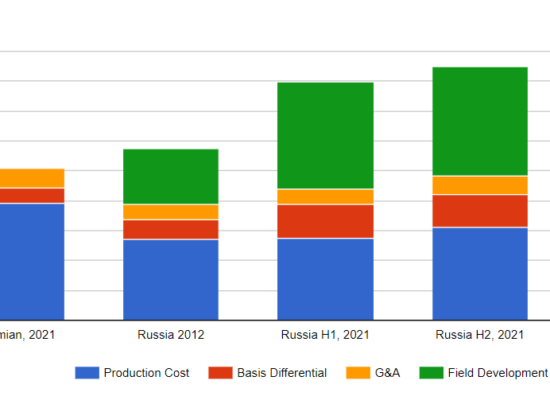
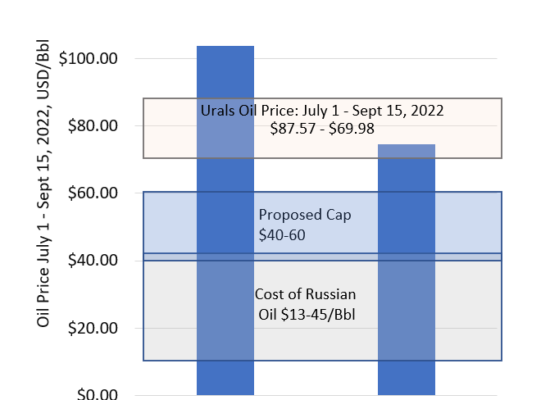
The cost of Russian oil in USD/Bbl for 2012, H1, 2022, and H2, 2022. Since Russia’s costs are not on a ‘full cycle’ cost basis like North America, Incorrys calculated an equivalent 2021 cost of the US Permian Basin for comparison. The total cost of Russian oil reaches USD $40-45/Bbl in 2021 including the cost for development of new fields however, as most new fields are located in remote areas of Siberia, they require significant infrastructure investment. The total cost of oil in Russia without new field development is comparable to costs in the Permian and other US Tight Oil basins.
Russian Oil Production Basins
October 25, 2022
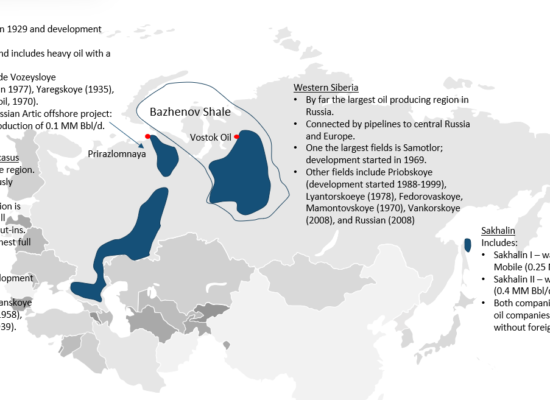
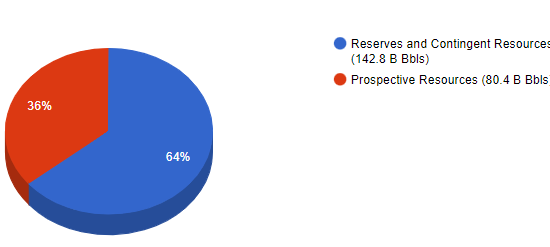
Russia primarily produces conventional oil but also has a very large resource of Tight Oil although there currently is no active exploration. The largest oil producing region in Western Siberia which accounts for over half of Russian oil production. The largest potential Tight Oil formation is the Bazhenov Formation, which covers most of Western Siberia, although Incorrys believes that development of Bazhenov Shale will not proceed in the near future due to the high cost and lack of technology in Russia.
October 11, 2022
Russian Oil Resources
Incorrys believes that without western oil producers and oilfield service companies, Russia will not be able to increase their reserves base, maintain production, or reduce costs as most new fields require the latest technology to explore, develop and produce. While production from older fields will decline at a rate of up to 40%, technology Russia had previously acquired will work for a short while. However, as the drilling of new wells is always required to maintain or grow supply, a drop in production due to aging technological is expected to occur this year.
Tanker Fleet to Redirect Russian Oil from Europe to Asia
October 8, 2022
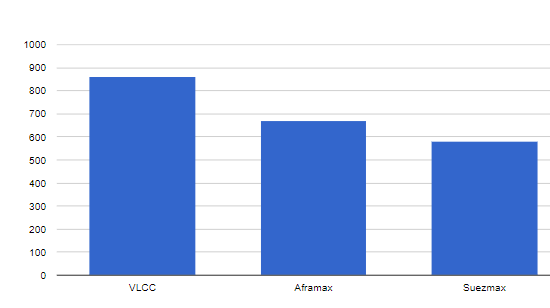
There are over 2,000 oil tanker ships worldwide of the Very Large Crude Carriers (VLCC), Aframax and Suezmax classes. By comparison, Russia’s Sovcomflot fleet only consists of about 60 of the same class of vessels with an additional 60 ships designed to transport refined products and to shuttle crude oil from offshore platforms to the coast. If sanctioned Russian oil needs to be redirected to Asia (primarily India and China) there will be a need for an additional 120 vessels of varying sizes, including VLCC.
Shipping Russian Oil
October 7, 2022
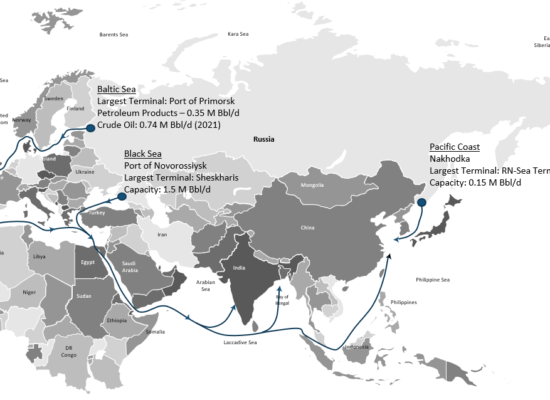
Russia exports crude oil from four main areas: the Baltic Sea, Black Sea, Pacific Coast and the Arctic. Russia has approximately 64 oil terminals although only a few of them are considered large export facilities. Shortly after European oil sanctions take effect by the end 2022, Russia would have to redirect marine traffic away from Europe to Asia, primarily. Discusses shipping transit times, tanker rates, and additional transportation costs to India and China for oil diverted from Europe.
Price Cap for Russian Oil
October 6, 2022
While the G7 and EU have agreed to impose a price cap on Russian oil (applied to the maritime transportation), they are still discussing some of the implementation aspects. The actual price cap itself has yet to be defined but is expected to be $40-$60/Bbl with the goal to reduce funds flowing to Russia. Currently, 60% of the Russian government’s income comes from the sale of oil and gas. Incorrys examines the impact of the price cap on Russian oil and discusses the pros and cons of the cap.
Western Canada Propane Forecast to 2030
July 5, 2022
Within Western Canada, propane demand has historically been dominated by conventional industrial heating, crop drying, and for oil and gas enhanced recoveries through miscible flooding, solvent injection, or fracking. The growth in liquids-rich natural gas supply throughout North America has resulted in an increase in North American propane supply in excess of domestic demand. This situation is even more pronounced in Western Canada where the oversupply is expected to continue past 2030.
How Russian Oil Revenue Will Decline
May 12, 2022
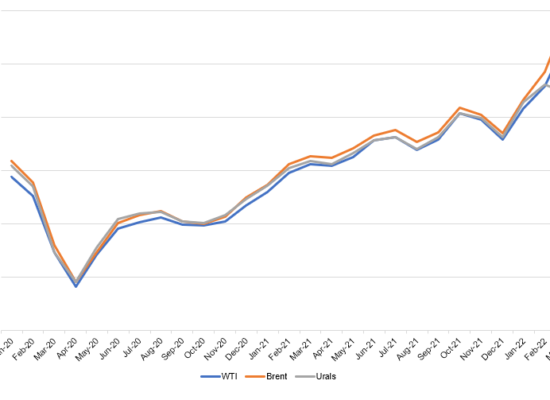
The price differential between Brent and the Russian oil benchmark of Urals from January 2020 through March 2022 has widened considerably since Russia invaded the Ukraine in February. The widening of the Brent-Urals oil price spread occurred as sanctions against the Russian economy were enacted, although most countries have not imposed an immediate full embargo on Russian oil.
April 19, 2022
Canada Can Supply More Oil to Global Markets in Medium Term
As the Russian invasion of Ukraine continues, the rest of the world has begun to scramble for Btus in every form – Crude, Natural Gas, Renewable sources. The environmental file is quickly heading to the backburner as countries realize the economic and geopolitical imperative to energy security and the importance of strong allies with control of energy.
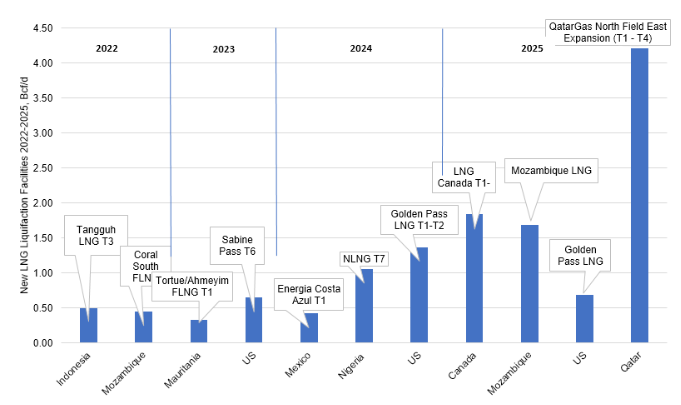
World LNG Liquefaction Capacity Growth by Project
April 11, 2022
LNG imports to Europe is one of the supply sources intended to replace natural has from Russia. In 2010 Europe received 10 Bcf/d of LNG. The US Government plans to deliver to Europe an additional 15 Bcm (1.5 Bcf/d) of LNG by the end of 2022 and increase deliveries by 5 Bcm (0.5 bcf/d) each following year by rerouting LNG exports from other countries, primarily Asia.
European LNG Imports
April 11, 2022
Europe currently has 37 LNG regasification terminals, of which 26 are located in EU member states. Between January 2021 and January 2022 only 40% of these terminals’ capacities were used however, utilization increased to almost 100% during the winter of 2021. This means that existing capacity will not be able to handle a large number of additional cargoes.
African Gas Supply to Europe
April 11, 2022
Incorrys estimates that although Africa can provide only a modest increase of gas exports to Europe in 2022-2023, African gas supply can grow in the next 3-6 years. Algeria is the 10th-largest gas producer globally. However, Algeria gas reserves and exports are declining. Algeria exports in 2020 were 3.8 Bcf/d; down from 5.2 Bcf/d in 2016-2017.


