

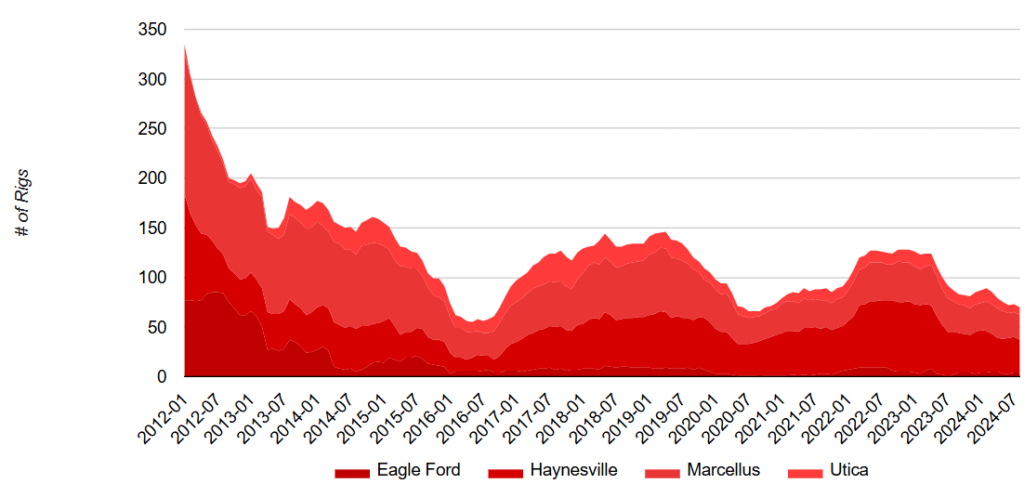
US Rig Count by Basin 2012-2024
February 7, 2025
US Rig count by basin for 4 major basins; Haynesville, Marcellus, Eagle Ford, and Utica from 2012 to H1 2024. The total gas rig count across the four U.S. shale gas basins declined by 22% in H1 2024 compared to 2023.
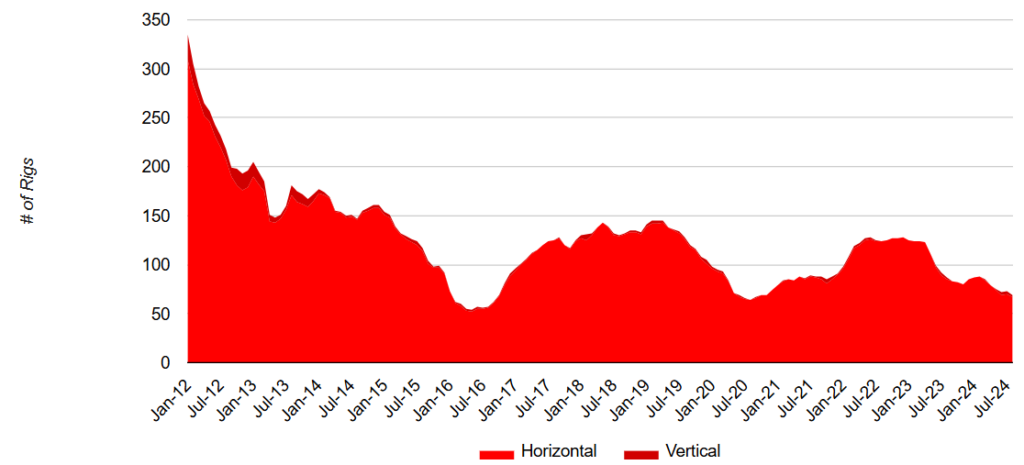
US Rig Count by Trajectory 2012-2024
February 7, 2025
US Rig count by trajectory (vertical and horizontal) for 4 major basins; Haynesville, Marcellus, Eagle Ford, and Utica from 2012 to H1 2024. Horizontal drilling offers higher production efficiency through longer laterals and more frac stages. The overall trend shows a preference for horizontal drilling due to efficiency and production advantages over vertical wells.
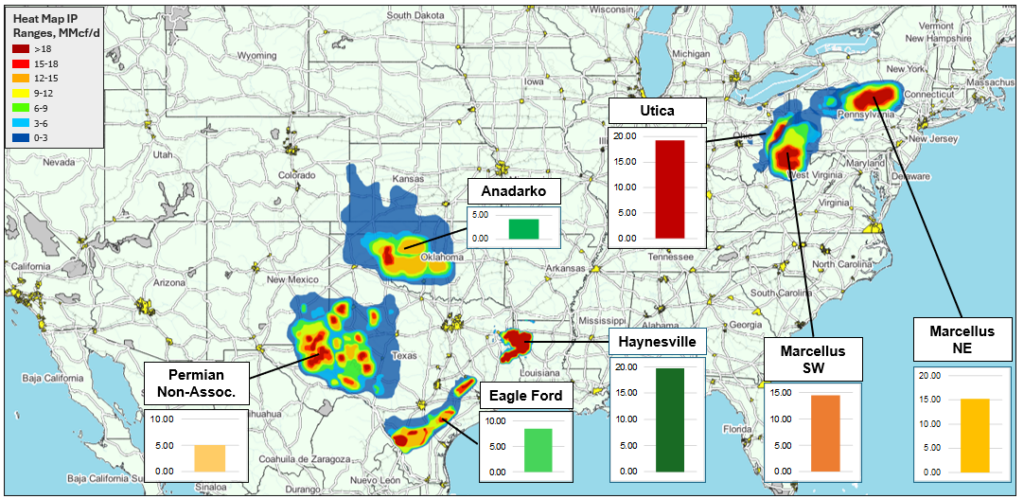
Initial Productivity (IP) Major US Gas Basins for 2023
February 10, 2025
Map showing 2023 new well 30 day Initial Productivity (IP) for major US Gas Basins. Haynesville has the highest new well 30 day IP at 20 MMcf/d, followed closely by Utica at just under 20 MMcf/d and Marcellus SW and NE at about 15 MMcf/d.
Estimated Ultimate Recovery (EUR) of Major US GAS Basins for 2023

February 10, 2025
New well Estimated Ultimate Recovery (EUR) for Major US Gas Basins in 2023 (Bcf). Marcellus SW has the largest new well EUR at about 20 Bcf, closely followed by Marcellus NE at about 18 Bcf. Permian and Anadarko have the lowest EUR at 5 Bcf and less.
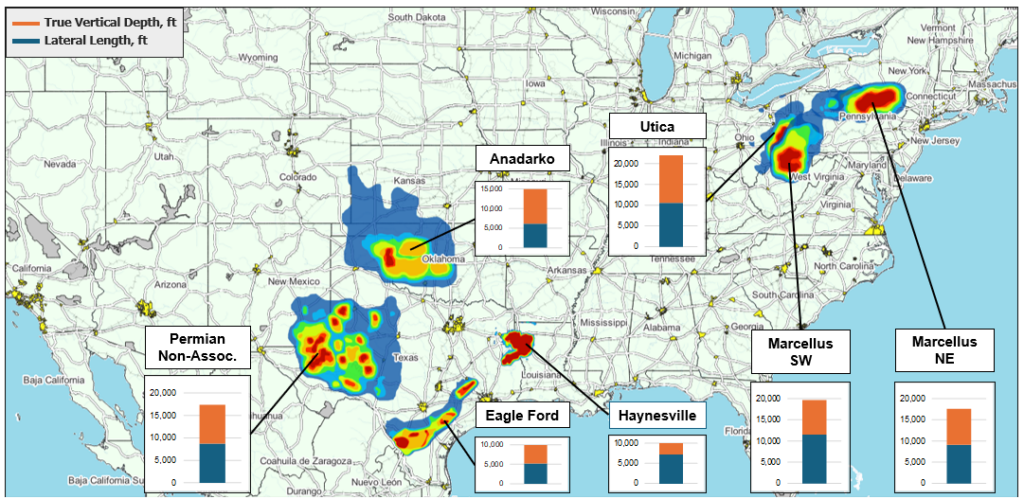
Well Depth of Major US Gas Basins 2023
February 10, 2025
Well depth of major US gas basins in 2023 showing both lateral length and true vertical depth, in feet, for a total new well depth. Marcellus SW has the longest lateral length at over 11,000′ while Utica has the deepest vertical depth at almost 12,000′. Combined, Utica has the longest lateral and vertical depth at over 22,000′ followed by Marcellus SW at just under 20,000′.
US Dry Natural Gas Production Forecast to 2040
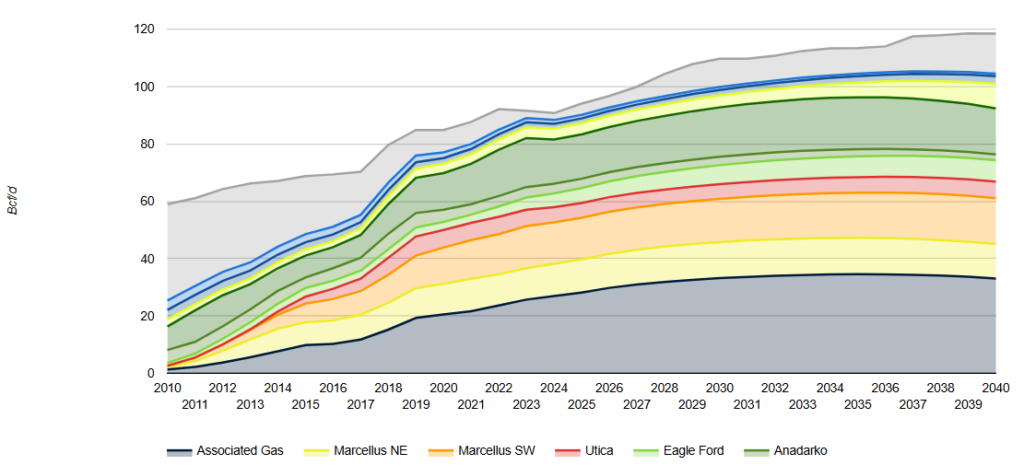
February 10, 2025
US dry natural gas production forecast to 2040 by major US basin, including associated gas. US dry natural gas production grew from about 59 Bcf/d in 2010 to almost 92 Bcf/d in 2023. To meet future demand, Incorrys is forecasting production to continue to grow to almost 120 Bcf/d by 2040.
Haynesville Raw Natural Gas Production Forecast to 2040
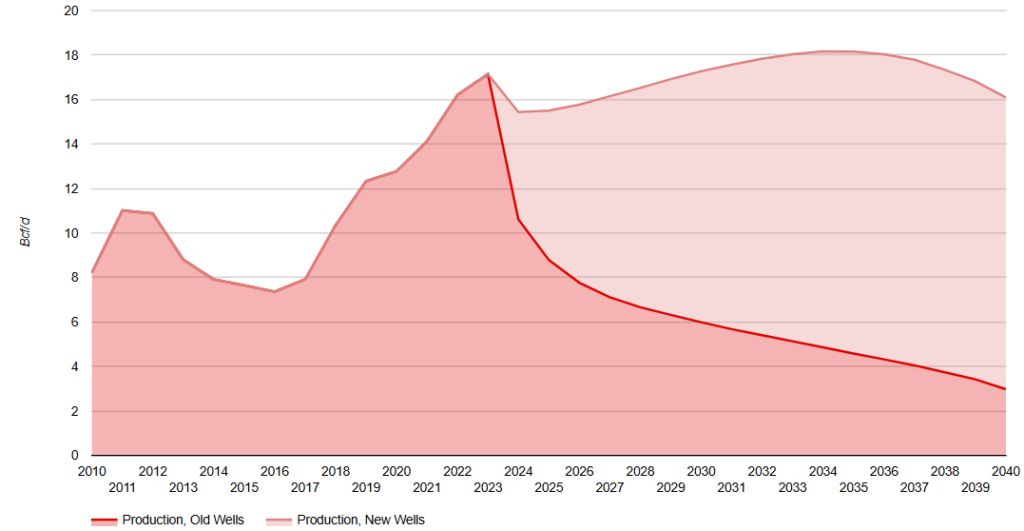
February 11, 2025
Forecast to 2040 of the raw natural gas production for Haynesville (located in eastern Texas and northern Louisiana). Additional charts show corresponding initial productivity (IP), well count, estimated ultimate recovery (EUR) and a drilling map of the area.
Proximity of LNG liquefaction plants located on the Gulf Coast makes Haynesville one of primary sources of gas for US LNG exports together with Permian Associated gas. Natural gas production was 16.7 Bcf/d in 2023 and is expected to reach over 18 Bcf/d around 2034.
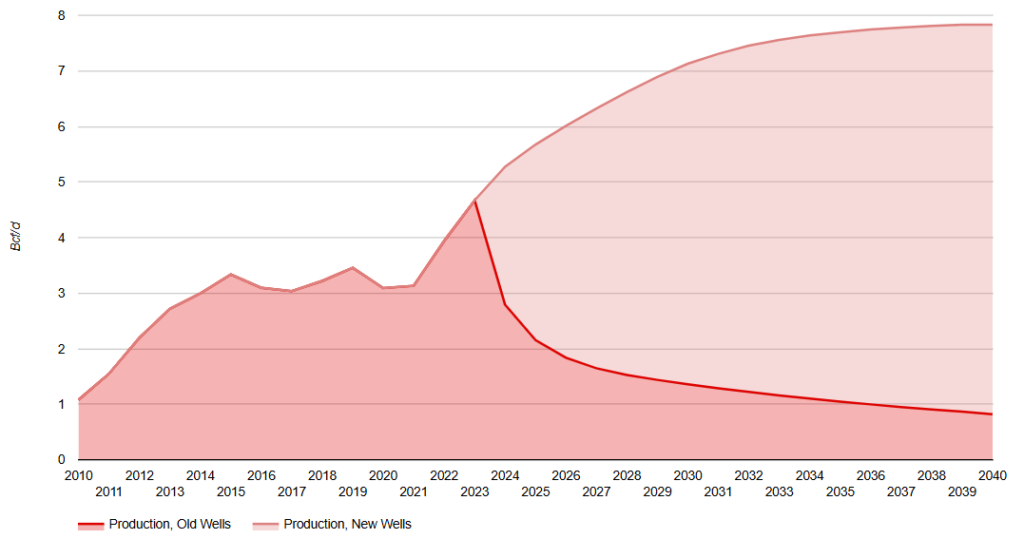
Marcellus NE Raw Natural Gas Production Forecast to 2040
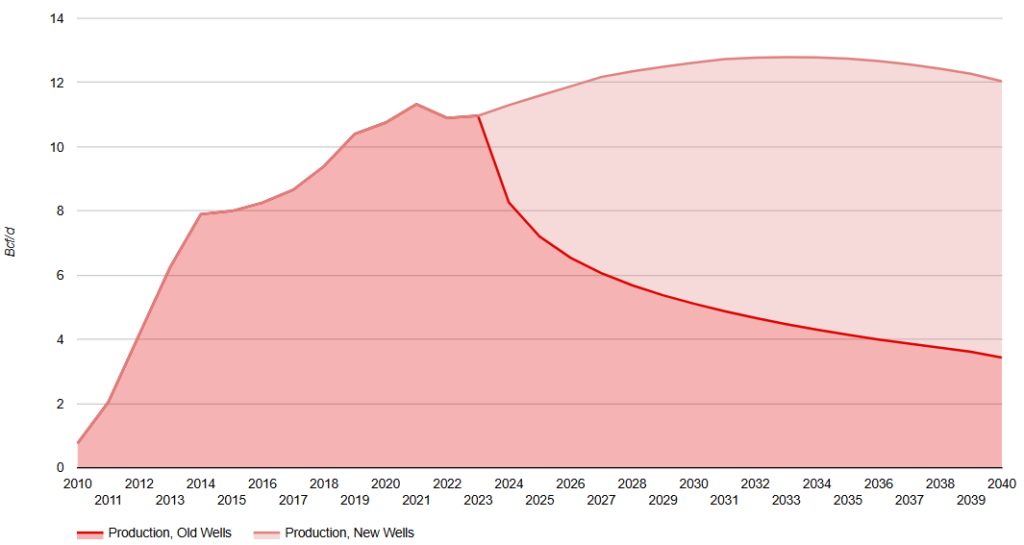
February 11, 2025
Forecast to 2040 of the raw natural gas production for Marcellus NE (located in NE Pennsylvania), one of two major producing regions in Marcellus. Additional charts show corresponding initial productivity (IP), well count, estimated ultimate recovery (EUR) and a drilling map of the area.
Marcellus NE produces mostly lean, dry gas and has new well initial productivity (IP) higher than in Marcellus SW. Natural gas production peaked at 11.3 Bcf/d in 2021 and is expected to continue to grow reaching 12.8 Bcf/d by 2032.
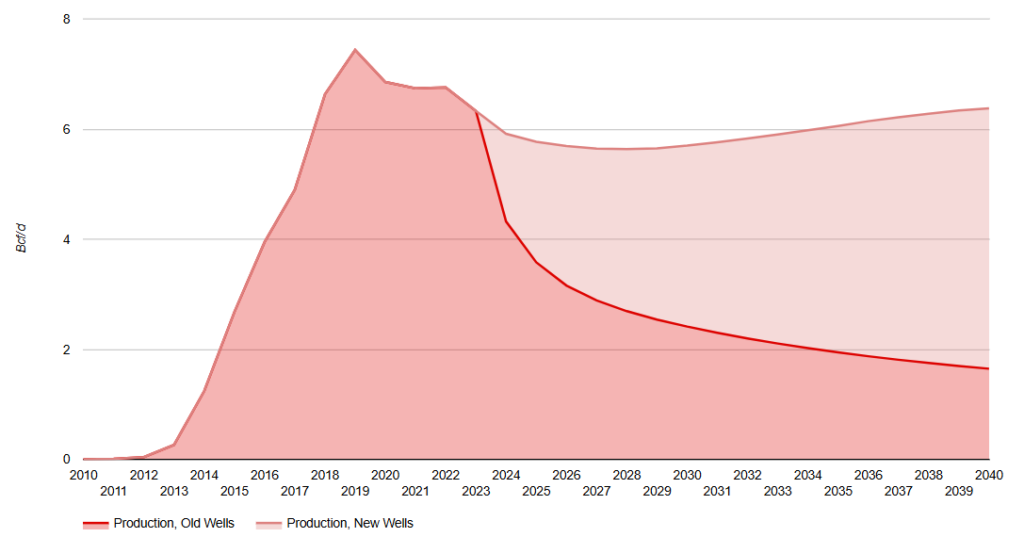
Marcellus SW Raw Natural Gas Production Forecast to 2040
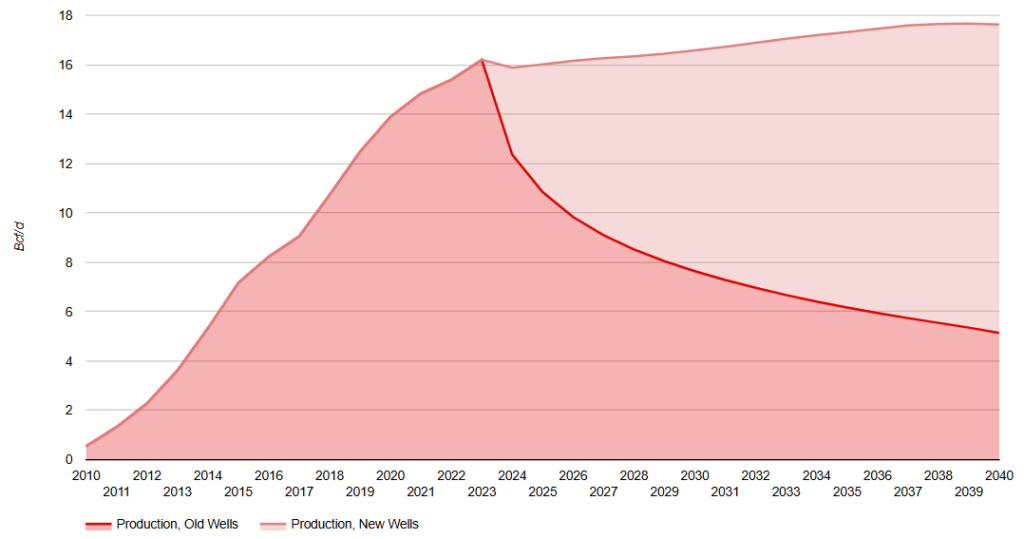
February 11, 2025
Forecast to 2040 of the raw natural gas production for Marcellus SW (located in SW Pennsylvania and West Virginia), one of two major producing regions in Marcellus. Additional charts show corresponding initial productivity (IP), well count, estimated ultimate recovery (EUR) and a drilling map of the area.
Marcellus SW produces liquids rich gas and includes a small ‘super’ rich area with liquids yield over 200 Bbl/MMcf. Natural gas production grows from 16.2 Bcf/d in 2023 to 17.7 Bcf/d in 2039.
Marcellus Total Raw Natural Gas Production Forecast to 2040
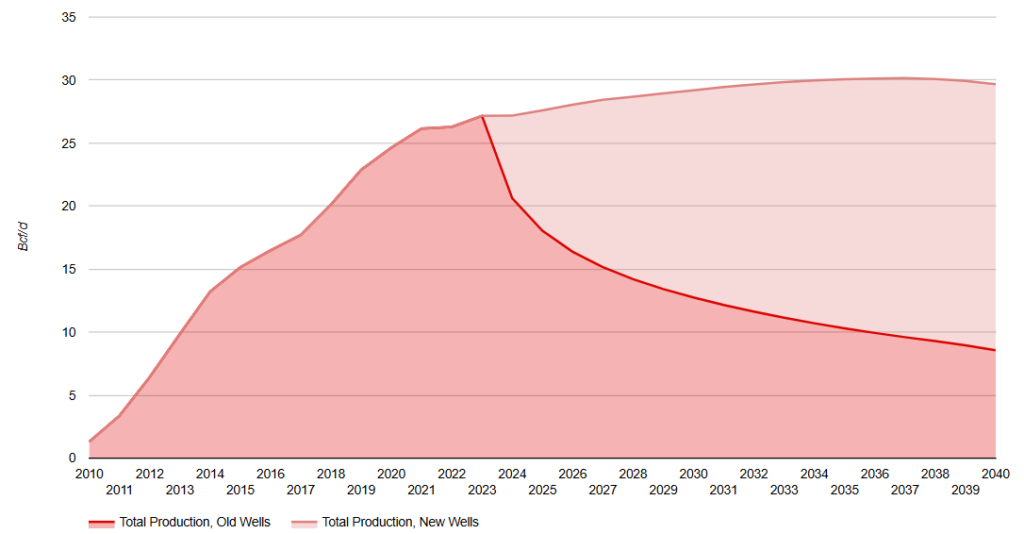
February 12, 2025
Forecast to 2040 of the raw natural gas production for the total Marcellus area (located primarily in Pennsylvania and West Virginia and includes both the Marcellus NE and SW areas). Additional charts show well count and a drilling map of the area.
Total Marcellus raw gas production was 27.2 Bcf/d in 2023 and is expected to reach 30.2 Bcf/d in 2037 before slowly declining over the last few years of the forecast.
Utica Raw Natural Gas Production Forecast to 2040
February 12, 2025
Forecast to 2040 of the raw natural gas production for Utica (located primarily in East Ohio plus some in NE and SW Pennsylvania, partially overlapping Marcellus Shale). Additional charts show corresponding initial productivity (IP), well count, estimated ultimate recovery (EUR) and a drilling map of the area.
Utica production growth during the short period to 2017 was primarily targeting liquids yields, leading to lower full cycle costs due to the liquids (revenue) uplift. Incorrys expects the liquids rich targets to mature resulting in the full cycle of cost of dry gas being more comparable to other basins.
Eagle Ford Raw Natural Gas Production Forecast to 2040
February 14, 2025
Forecast to 2040 of the raw natural gas production for Eagle Ford (located in south Texas). Additional charts show corresponding initial productivity (IP), well count, estimated ultimate recovery (EUR) and a drilling map of the area.
Eagle Ford has oil, condensate and natural gas areas. Currently, drilling is conducted towards oil and liquids rich gas although drilling is expected to shift toward areas with smaller liquids yield during the forecast period.
Permian Raw Natural Gas Production Forecast to 2040
February 14, 2025
Forecast to 2040 of the raw natural gas production for Permian (located in Texas and southeastern New Mexico). Additional charts show corresponding initial productivity (IP), well count, estimated ultimate recovery (EUR) and a drilling map of the area.
Permian is primarily an oil basin which produces condensate and natural gas with varying liquids yield. Currently, most drilling is focused on oil, however, oil production will start to decline during the forecast period due to maturity of the basin. At this point, the drilling for natural gas is expected to increase.
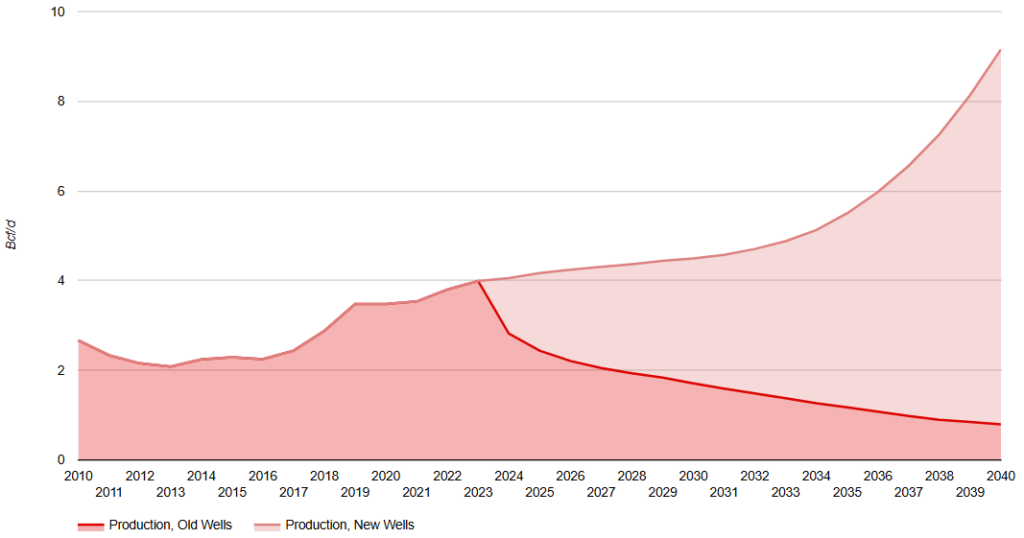
Anadarko Raw Natural Gas Production Forecast to 2040
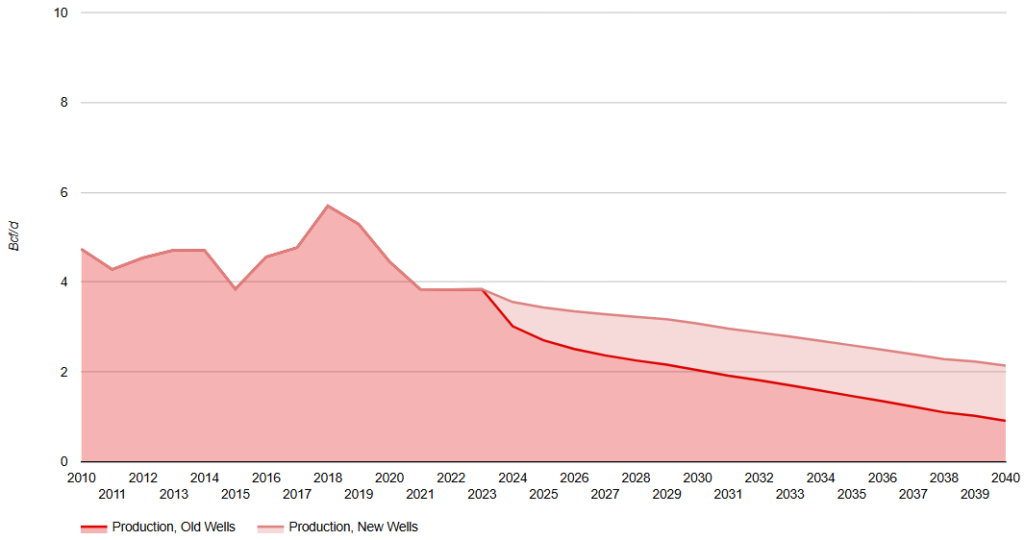
February 14, 2025
Forecast to 2040 of the raw natural gas production for Anadarko (located in western Oklahoma and NE Texas, extending to SW Kansas and SE Colorado). Additional charts show corresponding initial productivity (IP), well count, estimated ultimate recovery (EUR) and a drilling map of the area.
Anadarko production reached almost 5.7 Bcf/d in 2018 before starting a downward trend. Incorrys id forecasting production to decline to just 2.1 Bcf/d by 2040.
San Juan Raw Natural Gas Production Forecast to 2040
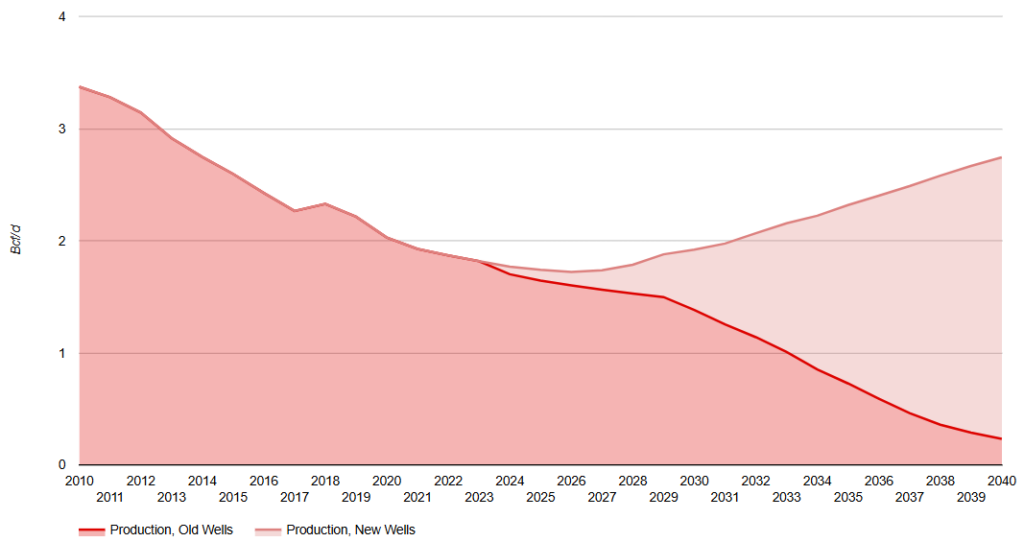
February 15, 2025
Forecast to 2040 of the raw natural gas production for San Juan ( located northwestern New Mexico extending into southwest Colorado). Additional charts show corresponding initial productivity (IP), well count, estimated ultimate recovery (EUR) and a drilling map of the area.
San Juan raw gas production dropped steadily to about 1.8 Bcf/d in 2023, due to declines in coalbed methane production, and is expected to continue to fall for a few more years and then grow to 1.9 Bcf in 2030 and 2.4 Bcf/d in 2040.
Green River Raw Natural Gas Production Forecast to 2040
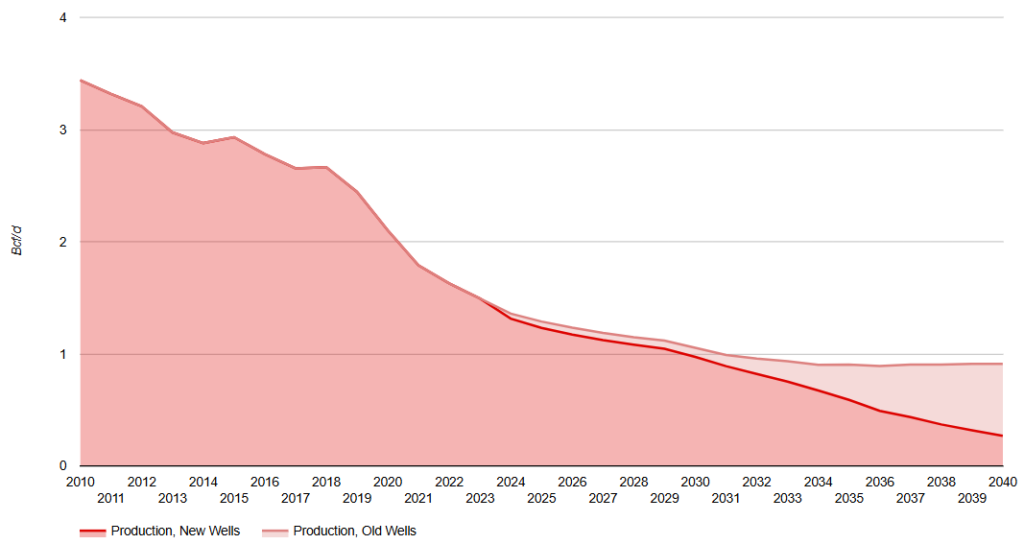
February 15, 2025
Forecast to 2040 of the raw natural gas production for Green River (located primarily in Wyoming, extending into northern Colorado). Additional charts show corresponding initial productivity (IP), well count, estimated ultimate recovery (EUR) and a drilling map of the area. Green River raw gas production dropped to around 1.5 Bcf/d in 2023 and is expected to continue to fall reaching 0.9 Bcf/d by 2033.
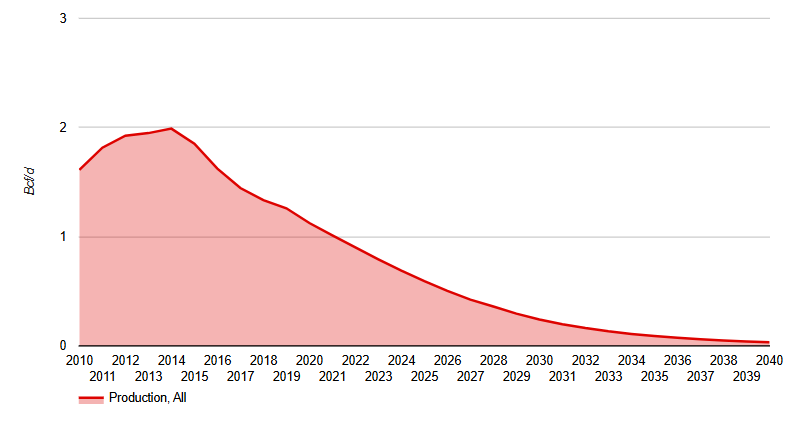
Arkoma Raw Natural Gas Production
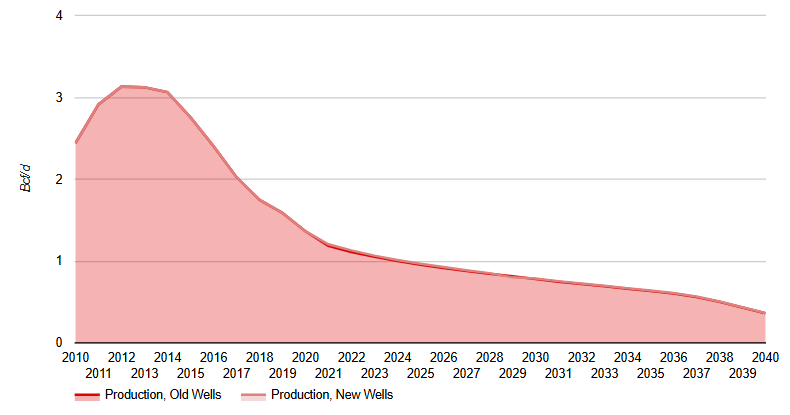
July 2, 2021
Forecast to 2040 of the raw natural gas production from Arkoma (located in Arkansas and Oklahoma). Additional charts show corresponding initial productivity (IP), well count, rig count, estimated ultimate recovery (EUR) and a drilling map of the area. Arkoma production was focused on Fayetteville Shale and Woodford Shale, however, both shales are now mature and Incorrys does not expect any further development after 2030.
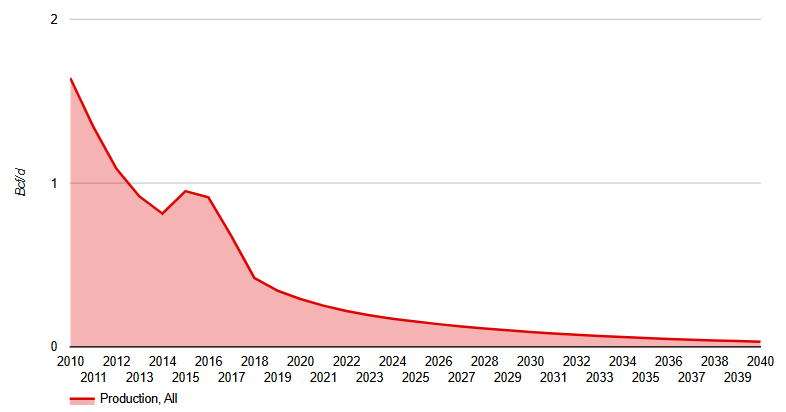
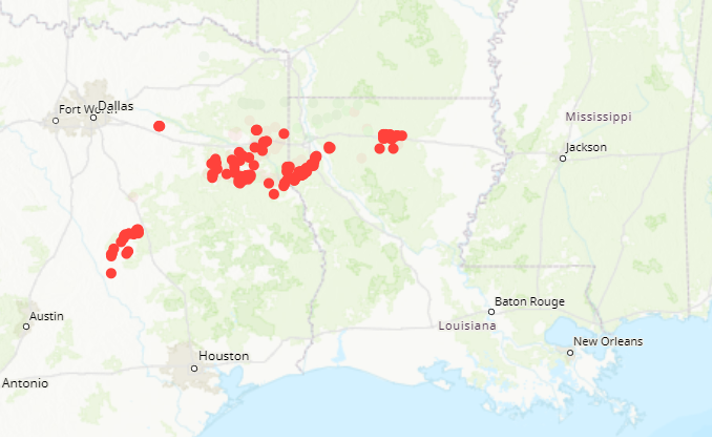
Barnett Raw Natural Gas Production
July 5, 2021
Forecast to 2040 of the shale gas production from Barnett (located north of Dallas and Ft Worth Texas). Additional drilling map of the area. Barnett was the first basin to prove horizontal drilling and multistage fracking for shale gas. Barnett consists of a gas area in the south portion of the basin and oil and condensate area in the north portion.
Gulf of Mexico Offshore Natural Gas Production
July 5, 2021
Forecast to 2040 of the natural gas production from the offshore Gulf of Mexico (located offshore Texas and Louisiana). Additional drilling map of the area. Current natural gas focused drilling in the Gulf of Mexico is very limited due to the high cost relative to other basins. Incorrys does not expect Gulf of Mexico gas production to recover during the forecast period and is negligible by 2040.
Other Natural Gas Basins and Plays
April 15, 2025
This shows other basins and plays in the US Gulf Coast and Rockies regions. In the US, Gulf Coast basin is the Travis Peak formation, Bossier formation, and Cotton Valley formation. In the Rockies area, there is Unita, Piceance, Powder River, Paradox, and DJ Niobrara. A brief description of each is provided in the details.