

North American Power Emissions to 2035
November 06, 2025
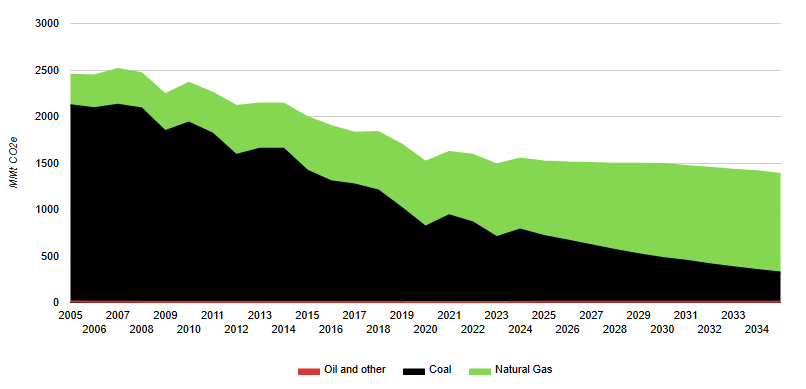
North American power generator emissions to 2035 by fossil fuel (coal, natural gas, oil/other). By 2035, power carbon emissions will be reduced from 2005 levels in both the US (44% lower) and Canada (36% lower) – both countries benchmark year for Paris Commitments.
Global Greenhouse Gas (GHG) Emissions
May 7, 2024
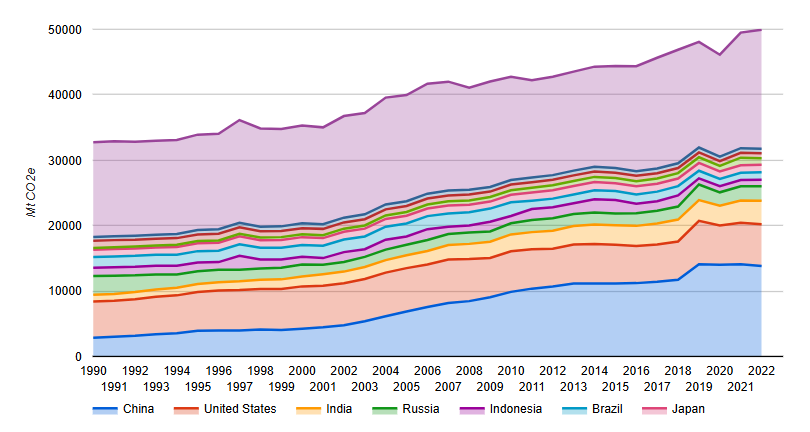
Historical global greenhouse gas (GHG) emissions, by country, between the years 1990 and 2022. Additional chart showing top emitters on a map. Global GHG emissions reached a record high of just over 48,089 million tonnes CO2 equivalent (Mt CO2eq) in 2019. Emissions declined in 2020 due to covid pandemic and resulting economic slowdown returning to an upward trend in 2021 and 2022 reaching almost 50,000 Mt CO2eq.
Annual Share of World GHG Emissions
April 29, 2024
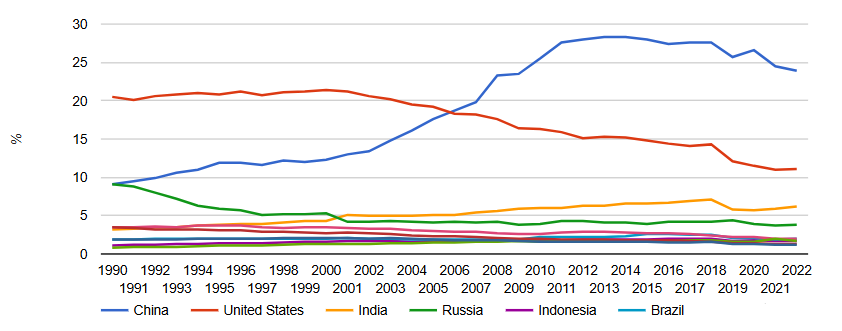
World share (%) of GHG emission for largest emitters worldwide. China surpassed the US to become worlds largest emitter of GHG in 2006 and has since doubled the US in overall share. Canada’s GHG emissions have declined slightly.
Per Capita GHG Emissions
April 30, 2024
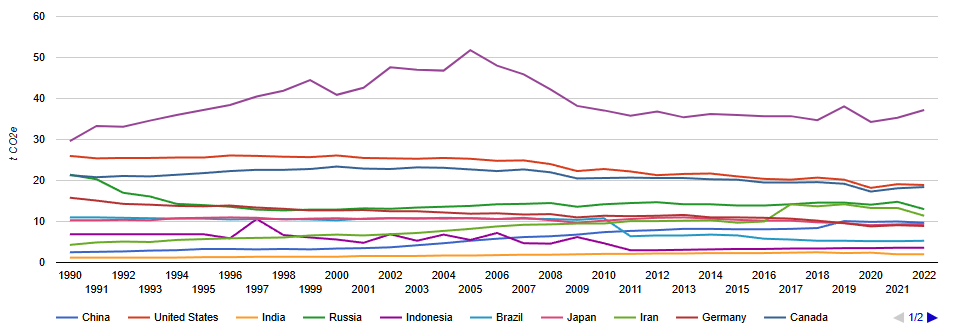
Greenhouse gas (GHG) emissions, per capita from 1990 to 2022, for the eleven largest emitters. Qatar has largest GHG emissions per capita, by a considerable margin, followed by the US and Canada. Differences in heating and cooling requirements due to country location can influence per capita intensity.
Global Historical CO2 Emissions per Country
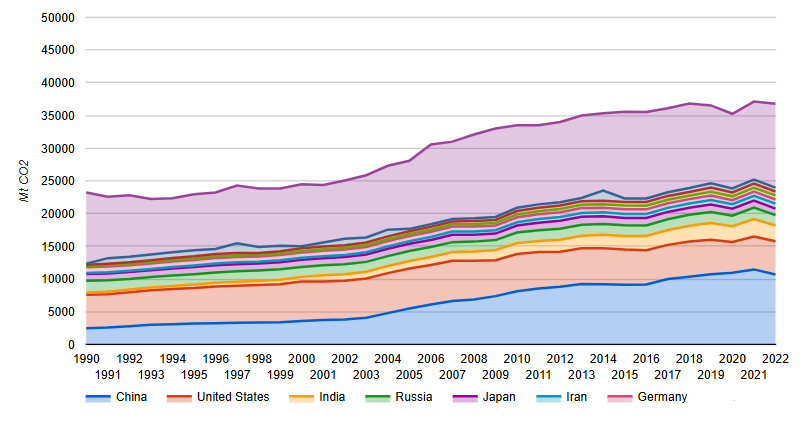
May 1, 2024
Historical global carbon dioxide (CO2) emissions, by country, between the years 1990 and 2022. CO2, the largest single contributor to global GHG emissions, represents almost three quarters of the total. China is the biggest emitter followed by the US.
North American Power Emissions Outlook by Region
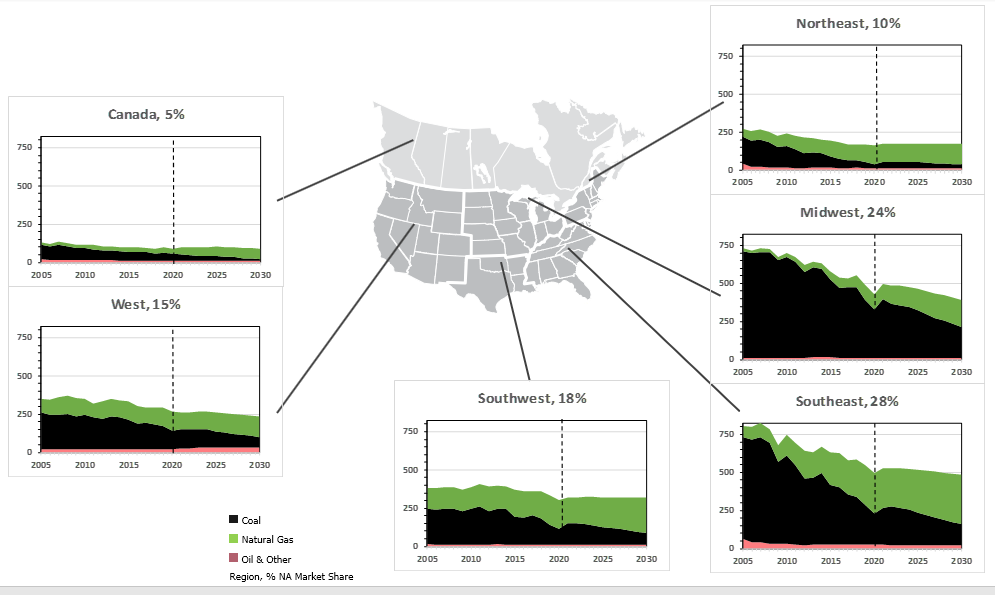
May 1, 2024
Detailed illustration of North American natural gas power emissions to 2030 by region and fossil fuel type (coal, natural gas, oil & other), including each areas regional share. The US Southeast and Midwest regions account for over half the the North American total power emissions while Canada accounts for the least.