May 1, 2024

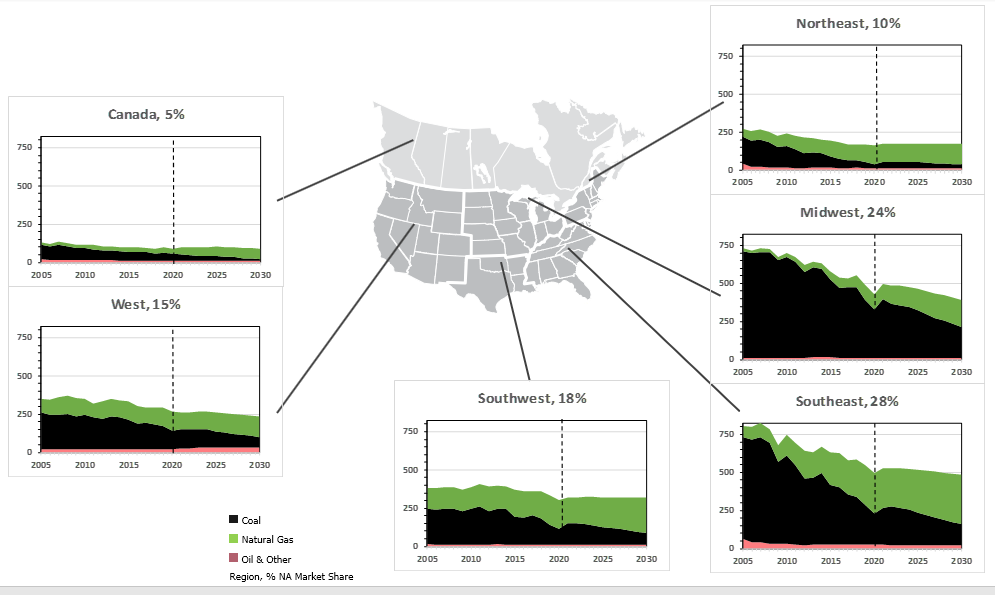
The chart shows a detailed illustration of North American natural gas power emissions by region by fuel type (coal, natural gas, oil & other). It also reflects the regional share of the total North America emissions. The US Southwest and Midwest regions account for over half the the North American total power emissions (28% and 24% respectively). The US Northeast, West and Southwest range from 10%-18% of the total while Canada accounts for just 5%.
Historically, coal emissions have been the largest contributor of power emissions averaging 75% of the North American total through 2014. The switch from Coal fired power to gas fired power has since been driving emission reductions in all regions but the majority is in the Midwest and Southeast. Today, coal contributes about half of the total North American power emissions and this is forecast to continue to decline to about 30% by 2030.
See also:
Global Greenhouse Gas (GHG) Emissions 1990-2022
Annual Share of World GHG Emissions 1990-2022
Per Capita GHG Emissions 1990-2022
Global Historical CO2 Emissions by Country 1990-2022
North American Power Emissions to 2030

