

February 12, 2025
Total Marcellus raw gas production was 27.2 Bcf/d in 2023 and is expected to reach 30.2 Bcf/d in 2037. It slowly declines over the last few years of the forecast to 29.7 Bcf/d in 2040. Well Estimated Ultimate Recovery (EUR) for the 2 regions combined reached 42.4 Bcf in 2022 and dropped to 39.7 Bcf in 2023. EUR is expected to fall to 29.7 Bcf in 2030.
Marcellus Total Well Count
A total of over 15,000 wells have been drilled in the Marcellus SW and NE regions. The well count peaked in 2013 at almost 1700 wells declining to just over 700 in 2023. Incorrys expects the well count to average about 700 through 2040.
Marcellus Map
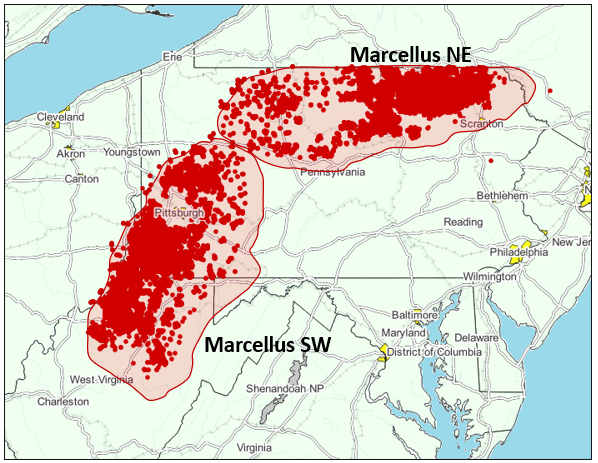
Marcellus gas wells 2000-2023.
Marcellus is located primarily in Pennsylvania and West Virginia. There are two primary production areas: Marcellus Pennsylvania Southwest and West Virginia (Marcellus SW) and Marcellus Pennsylvania Northeast (Marcellus NE). Marcellus SW produces liquids rich gas and includes a small ‘super’ rich area with liquids yield over 200 Bbl/MMcf. Marcellus NE produces mostly lean, dry gas and has new well initial productivity (IP) higher than in Marcellus SW. Marcellus development in Pennsylvania benefits from zero severance tax. Marcellus basin actually extends to New York state but development of Marcellus in New York is limited due environmental regulations related primarily to water issues. Incorrys analysis is based on historical data obtained from individual US states.
See Also:
Initial Productivity (IP) for Major US Gas Basins 2023
Estimated Ultimate Recovery (EUR) for Major US Gas Basins 2023
Well Depth of Major US Gas Basins 2023
US Dry Natural Gas Production Forecast to 2040
Marcellus NE Raw Natural Gas Production Forecast to 2040
Marcellus SW Raw Natural Gas Production Forecast to 2040