June 1, 2023
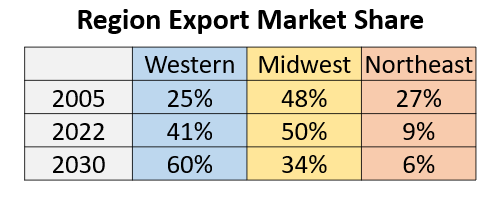
Looking back, it’s a more balanced export flow across Canada with a quarter of the exports going to western markets (Gas Transmission Northwest (GTN) down into California and Northwest Pipeline going into the Pacific Northwest). Midwest was about 50% of exports in 2005 with the Alliance up and running (Northern Border fairly full coming from the Alberta/Saskatchewan border and exports into Minnesota through the Viking and Great Lakes systems). Niagara, Chippawa and Iroquois Gas Transmission (IGT) were near capacity in 2005 coupled with Maritime & Northeast (M&NE) accounted for the remaining 25% of exports. Increased competition from Marcellus supply has pushed out Canadian gas from Northeast markets – 27% of export market share in 2005, now 9%. However, New England pipeline development gridlock has stopped pipelines such as Constitution and Northeast Energy Direct from being constructed thereby allowing Canadian exports to remain strong via pipelines serving those markets (Iroquois and PNGTS). With the development of Marcellus (post 2010), we saw a reversal of the Niagara and Chippawa lines and Iroquois has become more of a peaking pipeline running very full on the high demand days in winter and then fairly reserved flows in the shoulder season. With the Deep Panuke and Sable Island now shuttered, M&NE is now basically an import pipeline.
In total, Canadian exports have declined by almost a third from over 11 Bcf/d of exports in 2007 to 7 Bcf/d in 2020. Exports were stronger in the last couple of years with 2021 increasing to 7.9 Bcf/d and 2022 up to 8.4 Bcf/d. Incorrys expects the next few years to remain similar to 2022. West Coast markets are expected to increase market share with the 2023 expansion of GTN capacity and development of LNG Canada/Coastal GasLink projects beginning in 2025. This drives natural gas exports over the next decade. In the Midwest, competition from Bakken associated gas has reduced Canadian gas competitiveness on the Northern Border pipeline where we see declines in flows from Canada; Chicago flows have been steady as they pickup volumes from the Bakken area; Alliance is fairly flat; a little bit of expansion on Great Lakes into the Midwest; and we see increases into New England as well as we have a couple expansions in that area.

However, exports are heavily weighted in 2030 toward western markets as LNG sees 60% market share going to those markets and we see northeast flows decline to about 6% in 2030. The reginal export market shares in 2035 are similar to 2030.
See Also:
Canadian Natural Gas Supply-Demand Balance Forecast to 2030
Alberta and Northeast BC Natural Gas Production Allocation Forecast to 2035
Natural Gas Requirements for Oil Sands Forecast to 2030

