

US Oil and Lease Condensate Production Forecast to 2040
September 13, 2024
Forecast of US crude oil and lease condensate production (MBbl/d) by major basin including Alaska and offshore. US crude oil and lease condensate production grew from about 5,500 MBbl/d in 2010 to 13,000 in 2023. Incorrys forecasts oil and lease condensate production will continue to grow peaking at about 14,000 MBbl/d by 2030.
US Raw Associated Gas Production Forecast to 2040
September 13, 2024
Forecast of US associated natural gas production (Bcf/d) by major basin. Associated gas production increased to 28.4 Bcf/d in 2023, up from 1.5 Bcf/d in 2010, driven by the increase in the gas/oil ratios within Tight Oil basins. Incorrys estimates associated gas production to reach almost 38 Bcf/d in the 2031-2037 timeframe.
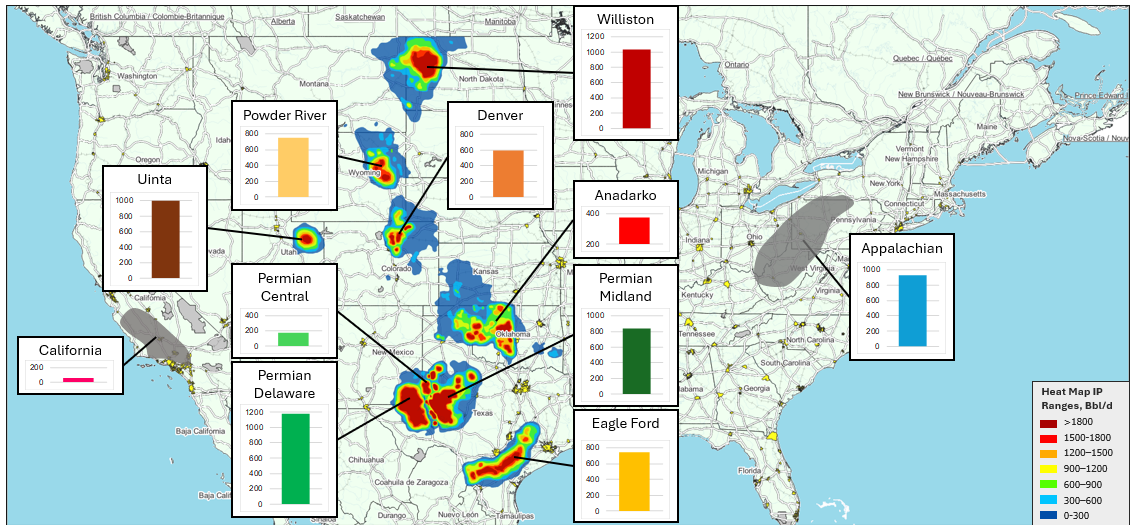
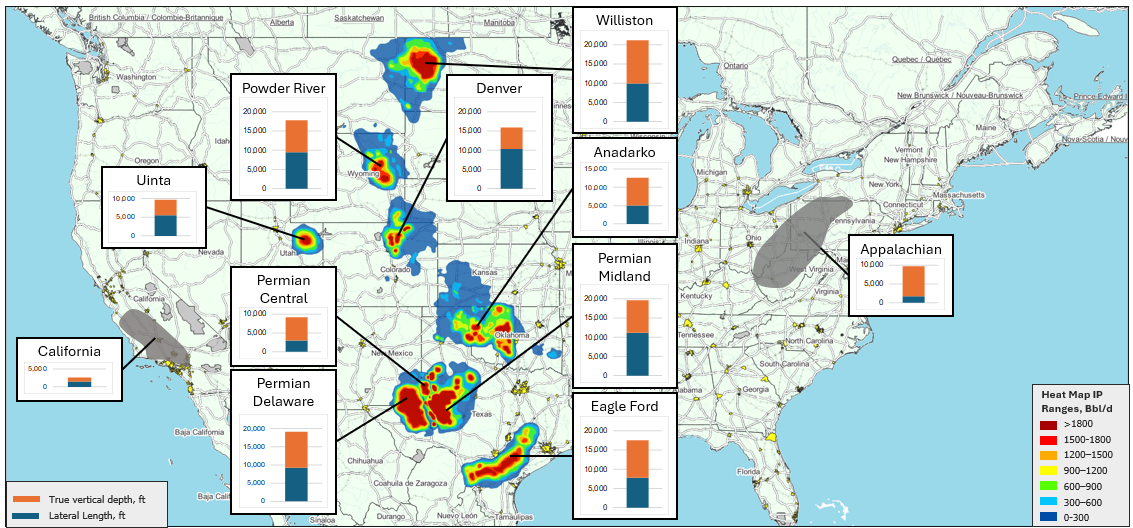
Initial Productivity (IP) of Major US Oil Basins 2023
September 13, 2024
The average 30-day initial productivity (Bbl/d) for new wells drilled in 2023 for major US Lower 48 oil basins. The Permian Delaware formation had the highest IP of all US oil basins at almost 1,200 Bbl/d in 2023. It was followed closely by the Williston basin at just over 1,000 Bbl/d.
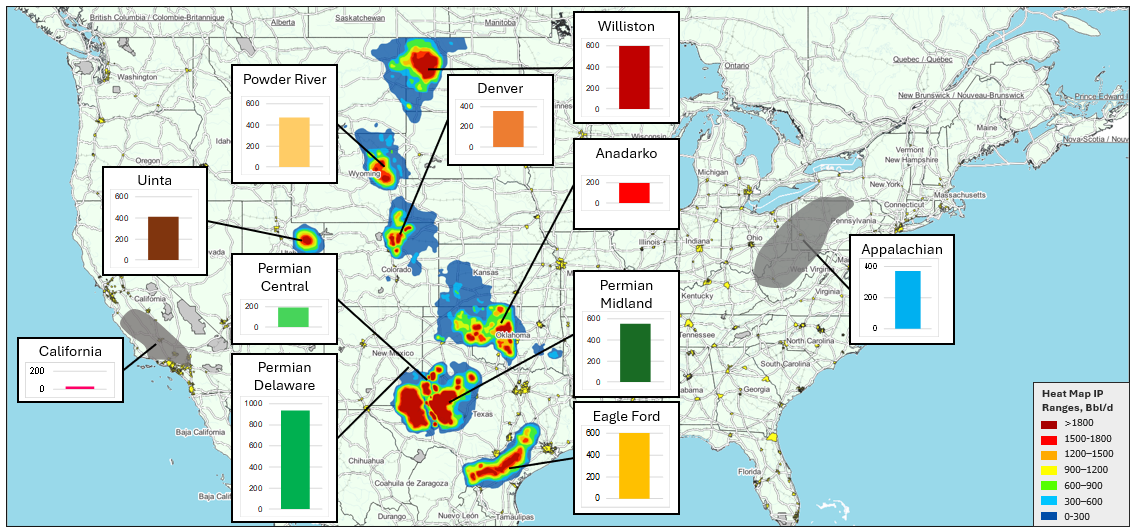
Estimated Ultimate Recovery (EUR) of Major US Oil Basins 2023
September 13, 2024
The average estimated ultimate recovery (EUR) for new wells drilled in 2023 (MBbl) for major US Lower 48 oil basins. The Permian Delaware formation had the highest EUR of all US oil basins at over 900 MBbl in 2023. It was followed by the Williston basin at 675 MBbl and Eagle Ford at 600 MBbl.
Well Depth of Major US Oil Basins 2020-2023
September 13, 2024
The average 2020-2023 well depth in feet, including both vertical depth and horizontal lateral length, for US crude oil wells in the major US Lower 48 oil basins. On average, the Williston basin had the longest total feet drilled for new 2023 wells at over 21,000 feet (ft) with a vertical depth of over 11,000 ft and lateral length of 10,000 ft.
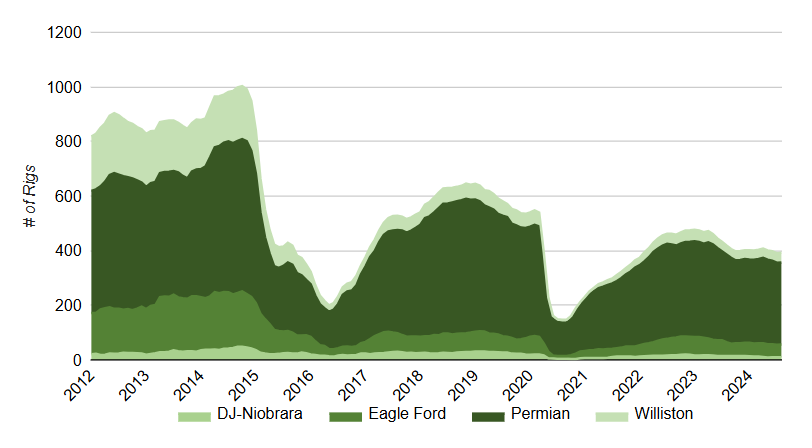
US Oil Rig Count Per Basin 2012-2024
September 13, 2024
US oil drilling rig count (2012-H12024) for four major U.S. shale basins: DJ-Niobrara, Eagle Ford, Permian, and Williston. Permian was the the most active basin peaking at 560 rigs in 2018 before dropping to just 122 in 2020 due to the impact of the Covid pandemic. The rig count has recovered somewhat to 330 in 2023.
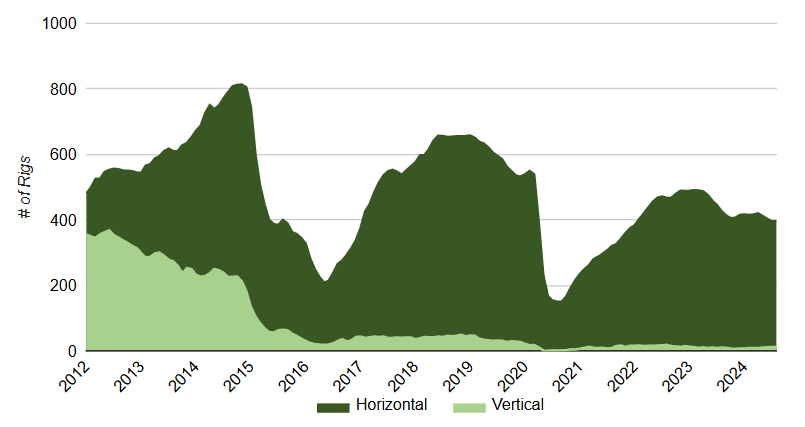
US Oil Rig Count By Trajectory 2012-2024
September 13, 2024
US oil drilling rig count split between horizontal and vertical drilling trajectories from 2012 to H1 2024. Horizontal Drilling peaked in 2014 at over 800 rigs declining to about 200 rigs in 2016. Drilling recovered post 2016 through 2019 before dropping again to just over 165 rigs due to the Covid pandemic.
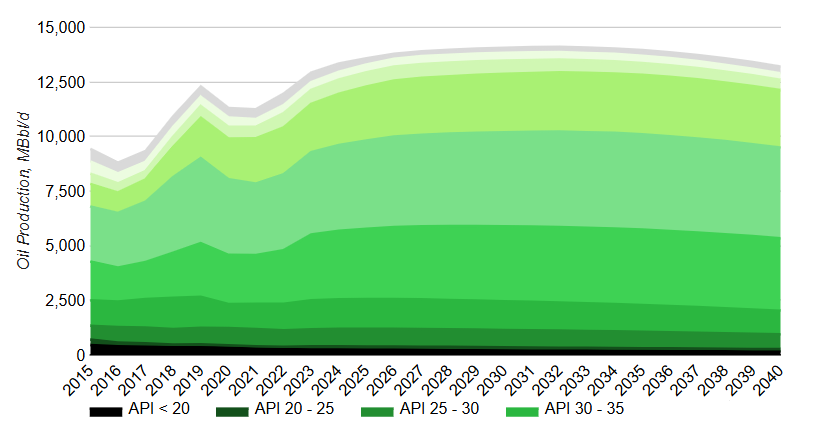
US Crude Oil vs Lease Condensate Production Forecast to 2040
September 13, 2024
Production forecast of crude oil vs lease condensate to 2030 broken down by API (American Petroleum Institute) gravity (lease condensate is defined as field liquids production with API greater than 45 degrees).
Lease condensate accounted for 26% of total oil production at about 3,200 MBbl/d in 2023, up from 23% (2,000 MBbl/d) in 2015. The increase is due to focused drilling in condensate rich Tight Oil Basins.
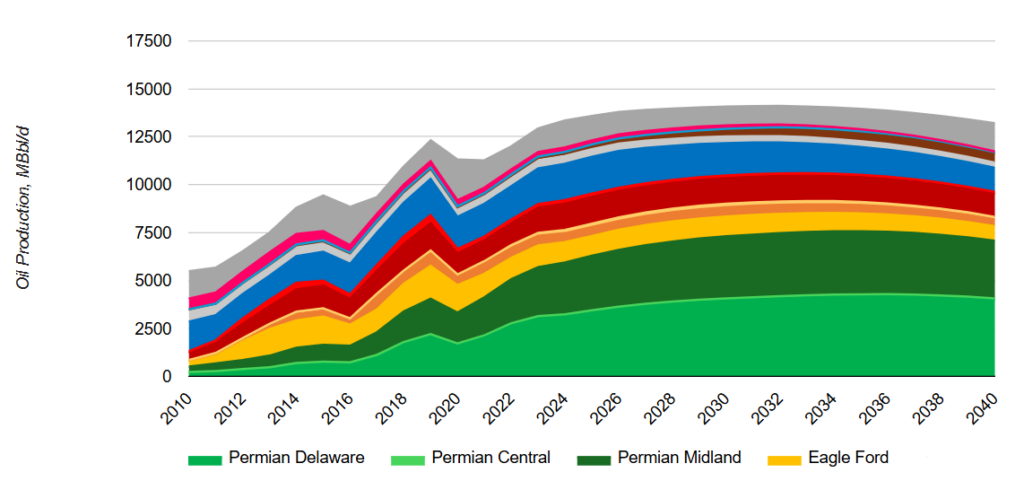
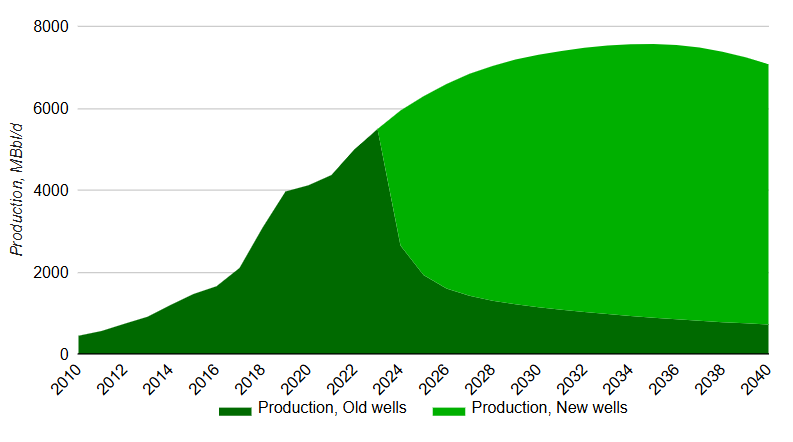
Permian Oil Production Forecast to 2040
September 15, 2024
Forecast to 2040 of Permian tight oil production (West Texas and Southeast New Mexico) by formation (Central Platform, Delaware, and Midland). Additional charts show initial productivity (IP), estimated ultimate recovery (EUR), number of wells and a map of the region.
In 2023, Delaware was the largest producer of the formations at about 2,800 MBbl/d followed by Midland at about 2,500 and Central Platform, by far the smallest, at just 65 MBbl/d.
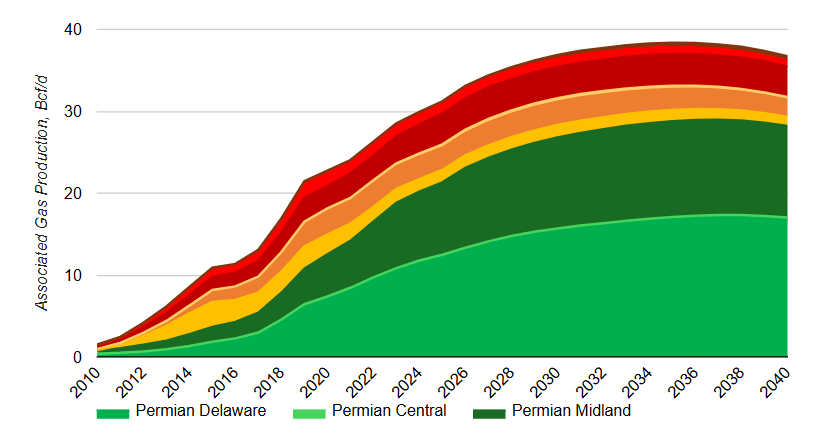
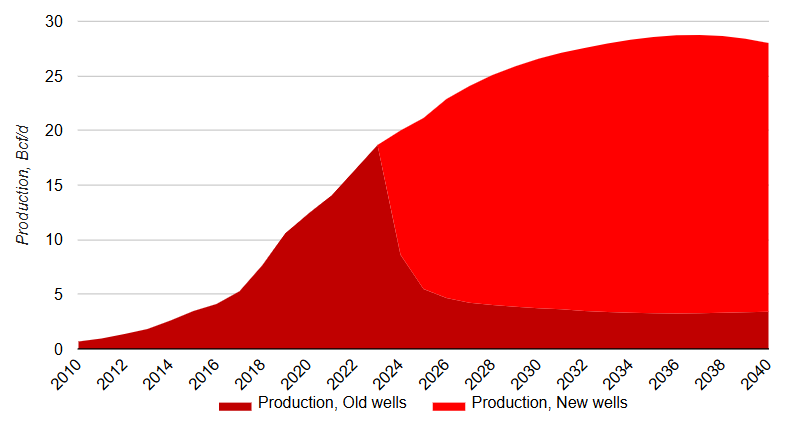
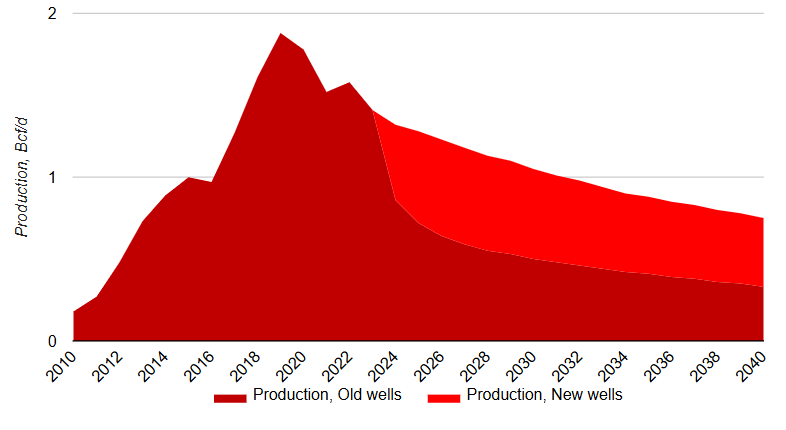
Permian Associated Gas Production Forecast to 2040
September 15, 2024
Forecast to 2040 of total Permian associated gas production (Bcf/d). Additional charts broken down by formation (Delaware and Midland). Total associated gas production from Permian grows from about 18 Bcf/d in 2023 to about 29 Bcf/d towards the end of the forecast period.
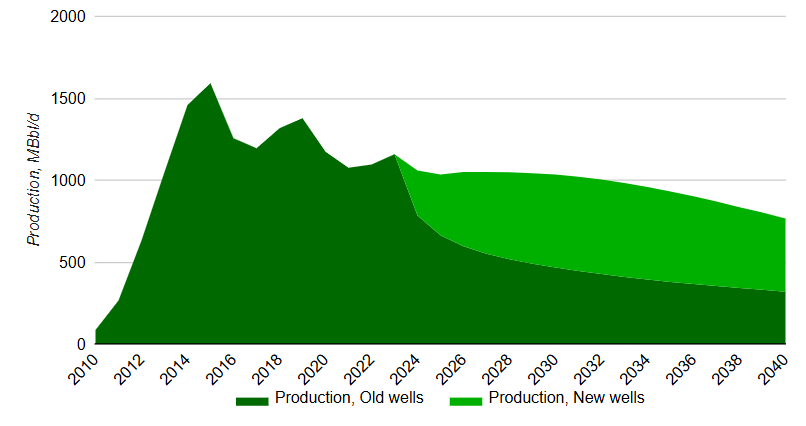
Eagle Ford Oil Production Forecast to 2040
September 15, 2024
Forecast to 2040 of Eagle Ford oil production (Texas). Additional charts show initial productivity (IP), estimated ultimate recovery (EUR), number of wells and a map of the region. Eagle Ford oil production was almost 1,200 MBbl/d in 2023 but is expected to decline to the 800 MBbl/d range by 2040 as the basin matures.
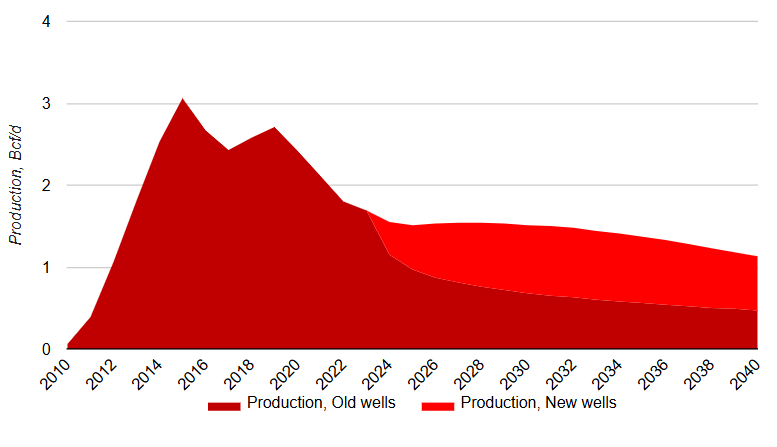
Eagle Ford Associated Gas Production Forecast to 2040
September 15, 2024
Forecast to 2040 of Eagle Ford associated gas production (Bcf/d). Eagle Ford raw associated gas production peaked at just over 3 Bcf/d in 2015 and has trended downward ever since due to the decline of oil production in the basin.
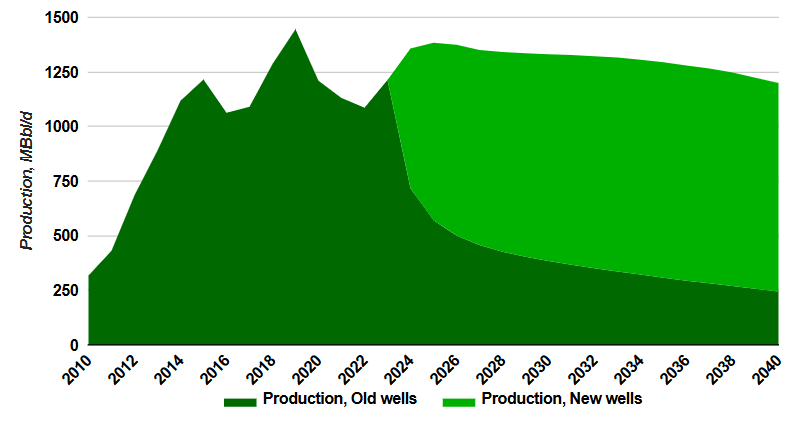
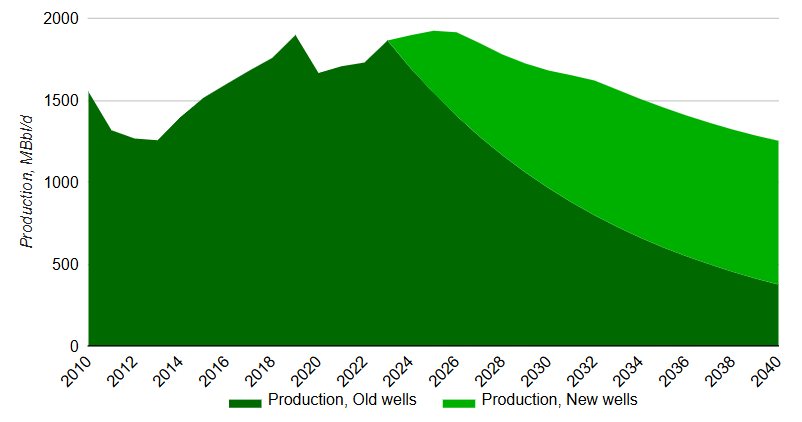
Williston Oil Production Forecast to 2040
September 15, 2024
Forecast to 2040 of Williston oil production (North Dakota and Montana). Additional charts show initial productivity (IP), estimated ultimate recovery (EUR), number of wells and a map of the region.
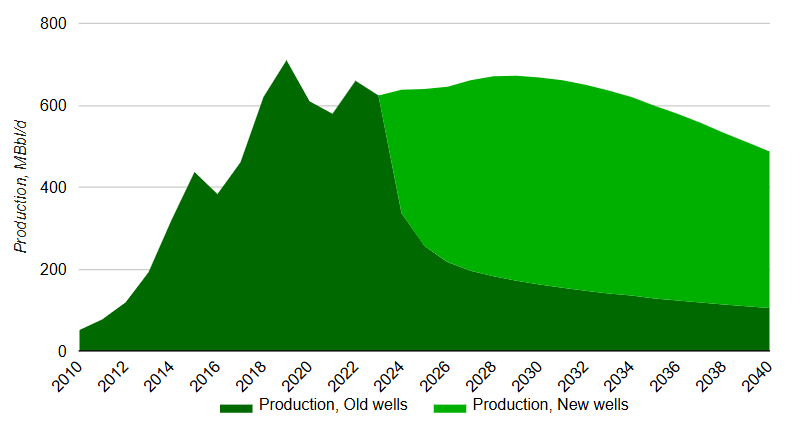
Williston oil production peaked at over 1,400 MBbl/d in 2019 declining to 1,200 MBbl/d in 2023. Production recovers to close to the 2019 peak by 2025 before declining through the remainder of the forecast.
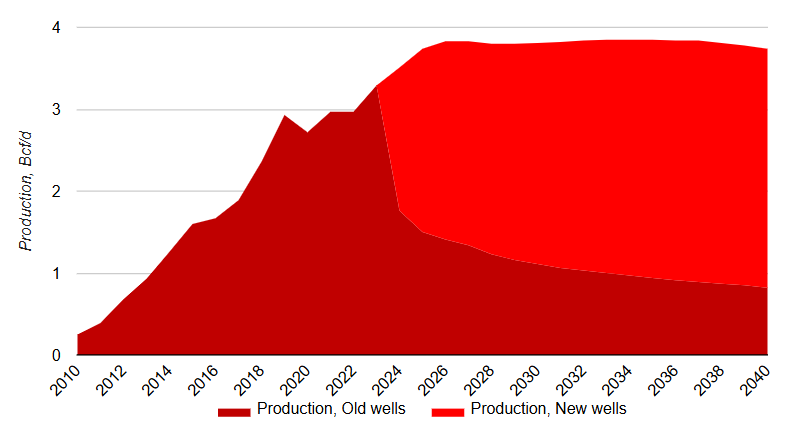
Williston Associated Gas Production Forecast to 2040
September 15, 2024
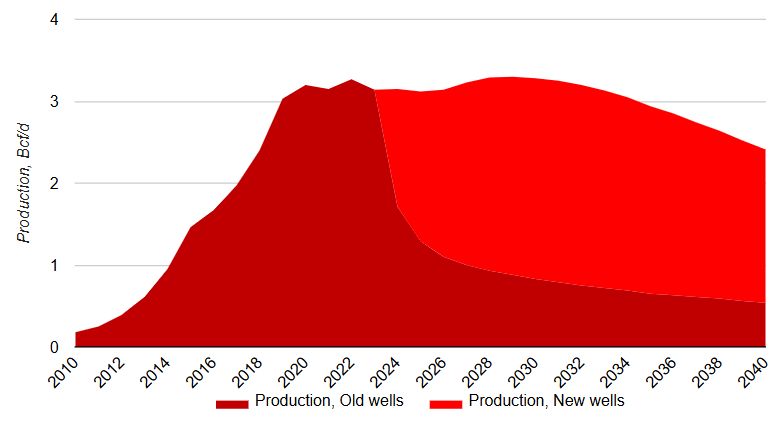
Forecast to 2040 of Williston associated gas production (Bcf/d). Williston raw associated gas production is expected to increase 0.5 Bcf/d between 2023 and 2026 to over 3.8 Bcf/d. It remains relatively flat through the remainder of the forecast.
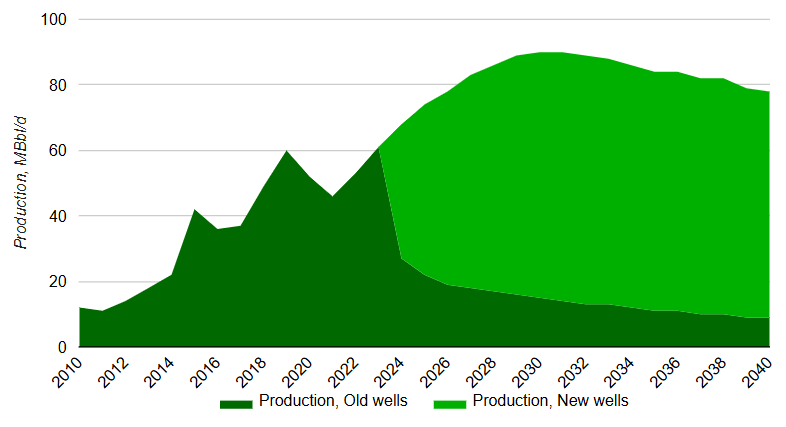
Appalachian Oil Production Forecast to 2040
September 15, 2024
Forecast to 2040 of Appalachian oil production (Pennsylvania, Ohio, West Virginia, Kentucky). Additional charts show initial productivity (IP), estimated ultimate recovery (EUR), number of wells and a map of the region. Appalachian oil production grows from about 60 MBbl/d in 2023 to a peak of about 90 MBbl/d by 2031 before declining to under 80 MBbl/d by 2040.
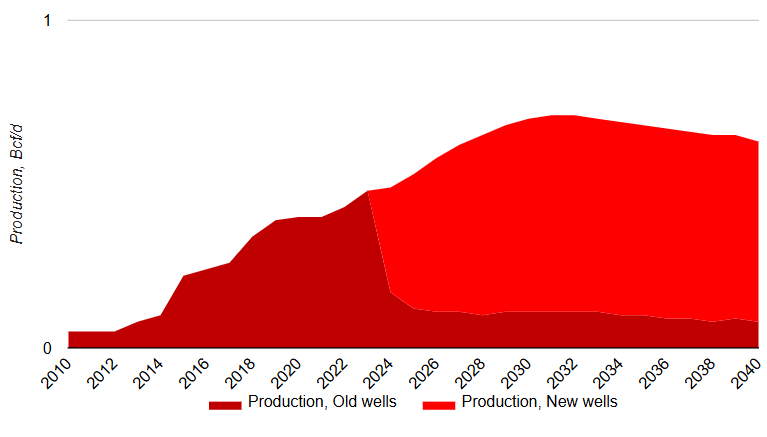
Appalachian Associated Gas Production Forecast to 2040
September 15, 2024
Forecast to 2040 of Appalachian associated gas production (Bcf/d). Appalachian raw associated gas production will grow to over 0.7 Bcf/d in 2032 up from just under 0.5 Bcf/d in 2023 due to the growth of volatile oil production.
Niobrara Oil Production Forecast to 2040
September 16, 2024
Forecast to 2040 of Niobrara oil production (located in southern Powder River (Wyoming) and Denver-Julesburg (Colorado) basins). Additional charts show initial productivity (IP), estimated ultimate recovery (EUR), number of wells and a map of the region.
Denver-Julesburg production reached its peak of 580 MBbl/s in 2019 and is expected to continue a general downtrend to about 250 MBbl/d in 2040. Powder River production was 160 MBbl/d in 2023 and is expected to peak at close to 200 MBbl/d by 2028.
Niobrara Associated Gas Production Forecast to 2040
September 16, 2024
Forecast to 2040 of Niobrara raw associated gas production (Bcf/d). Additional charts show the breakdown between Denver-Julesburg and Powder River. Combined, Denver-Julesburg and Powder River associated gas production reached over 3 Bcf/d in 2023 and is expected to peak at about 3.3 Bcf/d around 2030.
Uinta Oil Production Forecast to 2040
September 16, 2024
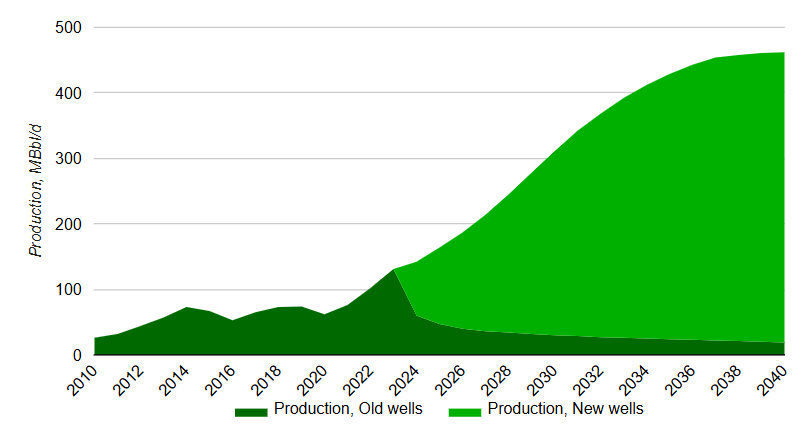
Forecast to 2040 of Uinta oil production (located in Utah). Additional charts show initial productivity (IP), estimated ultimate recovery (EUR), number of wells and a map of the region. Uinta oil production grew to about 125 MBbl/d in 2023 and is expected to continue to grow during the forecast period and reach around 450 MBbl/d after 2035.
Anadarko Oil Production Forecast to 2040
September 16, 2024
Forecast to 2040 of Anadarko oil production (located in Oklahoma and Kansas). Additional charts show initial productivity (IP), estimated ultimate recovery (EUR), number of wells and a map of the region.
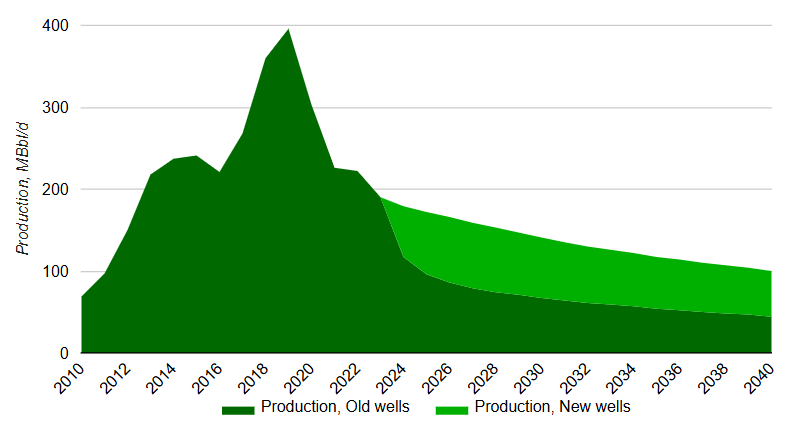
Anadarko production reached almost 400 MBbl/d in 2019 before starting a downward trend as the relative economics of the basin is worse compared to Tight oil basins such as Willison and Permian.
Anadarko Associated Gas Production Forecast to 2040
September 16, 2024
Forecast to 2040 of Anadarko raw associated gas production (Bcf/d). Anadarko raw associated gas production peaked at 1.9 Bcf/d in 2019 and has generally decline since dropping to 1.4 Bcf/d in 2023.
Gulf of Mexico Offshore Oil Production Forecast to 2040
September 16, 2024
Forecast to 2040 of Gulf of Mexico offshore oil production. Additional charts show initial productivity (IP), number of wells and a map of the region.
Incorrys forecasts Gulf of Mexico production based on analysis of new, announced, or under construction projects although there is significant uncertainty in new projects after 2028. Incorrys expects that Gulf of Mexico production will reach its peak of 1800 MBbl/d in 2026 and then start to decline reaching 1250 MBbl/d in 2040.
California Oil Production Forecast to 2040
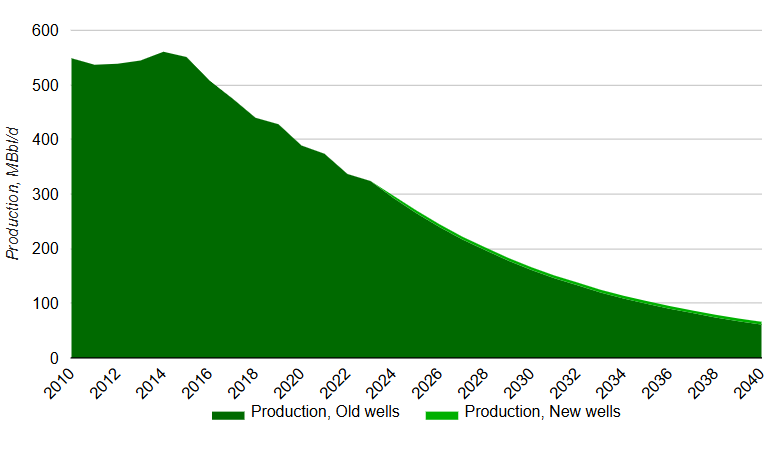
September 16, 2024
Forecast to 2040 of California oil production (located in Kern County, San Joaquin Valley and the Los Angeles basin). Additional charts showing a map of the region. California production declined from 1,000 MBbl/d in the early 1980s to 325 MBbl/d in 2023. Production is expected to continue dropping to about just 75 MBbl/d in 2040.
Alaska Oil Production Forecast to 2040
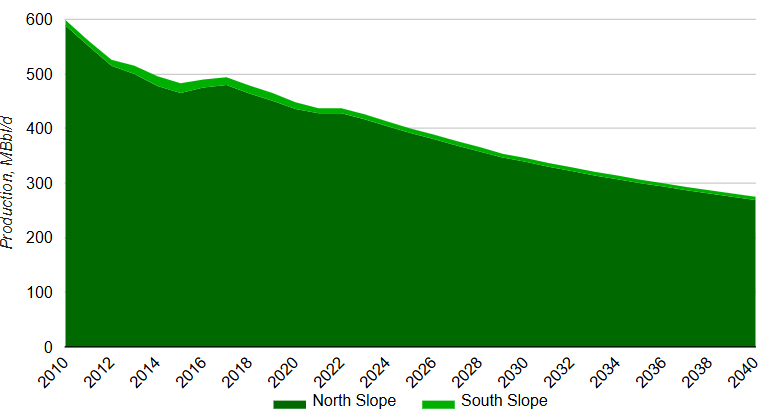
September 16, 2024
Forecast to 2040 of Alaska oil production (located in North and South Shore of Alaska). Additional charts show initial productivity (IP), number of wells and a map of the region.
Alaska oil production, almost all of which comes from the North Slope, decreases from 600 MBbl/d in 2010 to 430 MBbl/d in 2023. Incorrys projects oil production to continue to decline reaching 275 MBbl/d in 2040. The production forecast does not include upside potential from Alaska LNG which, if it goes ahead, could boost oil drilling activity.
East Texas Oil Production Forecast to 2040
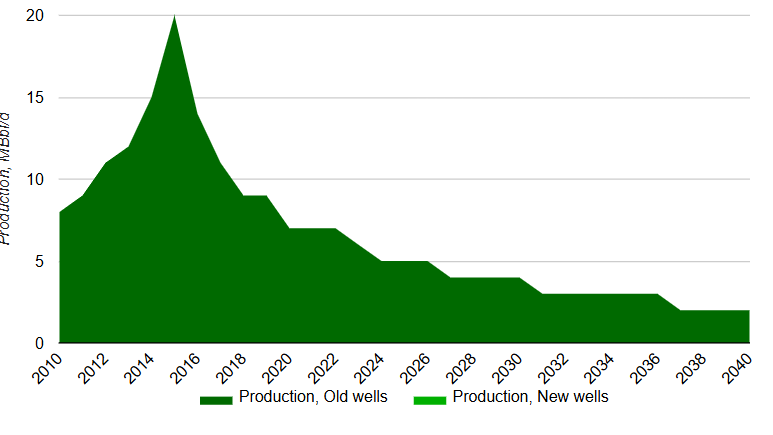
September 17, 2024
Forecast to 2040 of East Texas oil production (located in Southern Texas and Louisiana). Additional information showing a map of the region. The Texas–Louisiana coast is a conventional basin with declining production. Production peaked in 2015 at 20 Mbbl/d and is only 5 MBbl/d in 2023.
Largest US Publicly Traded Oil and NGL Producers 2022
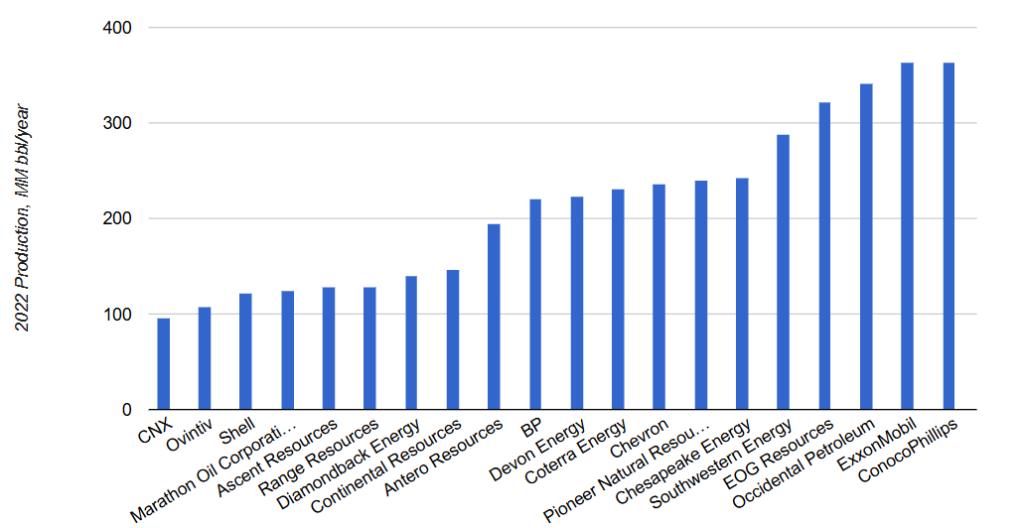
September 28, 2023
Oil and Natural Gas Liquids (NGL) production per company in 2022 is based on their annual reports. The largest producer is ConocoPhillips with production of 364 MM bbl/year followed by ExxonMobil (363.667 MM bbl/year).