

July 31, 2023
Wind Power Generation Capacity 2010-2022
Global wind generation capacity grew 5-fold between 2010-2022 from 180 GW to about 910 GW. Capacity grew almost 80 GW in 2022, the lowest build over the past 3 years (112 GW in 2020 and 95 GW in 2021), although it still ranks as the 3rd highest year. Total onshore capacity grew from 175 GW to 850 GW (2010-2022), almost 70 GW was added in 2022. China led the way in 2022 representing almost 50%, while the US accounted for 13% and Brazil 6%. Total offshore capacity grew from just 5 GW to 65 GW over the same timeframe of which 9 GW were added in 2022. Again, China led the way in 2022 representing almost 60% of the total while the UK and Taiwan each accounted for 14% and France and the Netherlands account for 5% each. Onshore wind accounted for 98% of the 2010 total dropping to 92% in 2022.
Wind Power Generation Capacity Market Share 2022
China accounts for over 40% (390 GW) of the total 910 GW of installed wind capacity followed by Europe representing almost 30% (255 GW) and the US 16% (140 GW). Combined, the top 3 regions account for over 85% of the total global capacity (785 GW) while the rest of the world represents under 15% at 120 GW – slightly lower than the US.
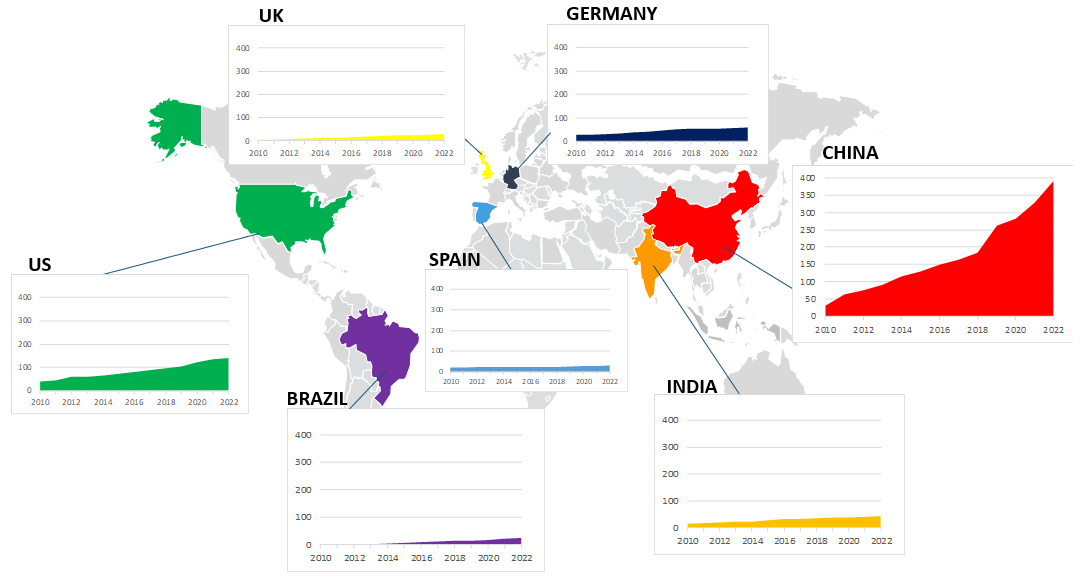
Wind Generation Capacity by Country 2010-2022
References:
GWEC, 2023, GWEC | GLOBAL WIND REPORT 2023, retrieved from https://gwec.net/wp-content/uploads/2023/04/GWEC-2023_interactive.pdf
IEA, (2022, September), Wind Electricity, retrieved from https://www.iea.org/reports/wind-electricity
Windpowernl (2023, March, 2), EU built 16 GW new wind in 2022, far behind 2030 ambitions, WindEurope says, retrieved from https://windpowernl.com/2023/03/02/eu-built-16-gw-new-wind-in-2022-far-behind-2030-ambitions-windeurope-says/
Windeurope (N\A), Wind energy in Europe: 2022 Statistics and the outlook for 2023-2027, retrieved from https://windeurope.org/intelligence-platform/product/wind-energy-in-europe-2022-statistics-and-the-outlook-for-2023-2027/
IEA, (2022, October, 26), China annual wind capacity additions 2018-2022 and average annual additions 2023-2025, retrieved from https://www.iea.org/data-and-statistics/charts/china-annual-wind-capacity-additions-2018-2022-and-average-annual-additions-2023-2025
Chinaenergyportal.org (2022, January, 27), “2021 electricity & other energy statistics (preliminary)”. Retrieved 19 February 2022 from https://chinaenergyportal.org/en/2021-electricity-other-energy-statistics-preliminary/
CWEA, (2023, March, 30), 2022 China Wind Power Hoisting Capacity Statistics Briefing Release, retrieved from https://neec.no/2022-china-wind-power-hoisting-capacity-statistics-briefing-release/#:~:text=By%20the%20end%20of%202022,30.51%20million%20kilowatts%20on%20sea.
U.S. Energy Information Administration (EIA) – (2023, March 6). “Wind, solar, and batteries increasingly account for more new U.S. power capacity additions”. Retrieved from https://www.eia.gov/todayinenergy/detail.php?id=55719 April 7, 2023
Deutsche Windguard GmbH, 2022, German wind energy in numbers, retrieved from (https://www.wind-energie.de/english/statistics/statistics-germany/
CEA. “Monthly Renewable Energy Generation Report, March 2022” (PDF). N|a. Retrieved from https://cea.nic.in/wp-content/uploads/resd/2022/04/Broad_overview_March_2022.pdf 29 June 2022.
Department for Energy Security and Net Zero (last update 2023, May, 11). “Energy Trends: UK renewables“ GOV.UK. Retrieved from https://www.gov.uk/government/statistics/energy-trends-section-6-renewables 30 March 2023.
Fernández L. (2023, January, 24), Cumulative wind power capacity in Spain from 2010 to 2022, retrieved from https://www.statista.com/statistics/421496/total-wind-power-in-spain/