

February 15, 2025
Peak production occurred in 2023 at 4.0 Bcf/d. Green River raw gas production dropped to around 1.5 Bcf/d in 2023 and is expected to continue to fall reaching 0.9 Bcf/d by 2033. Production remains at this level through 2040 as drilling increases slightly as the relative economics will be comparable to other basins.
Green River Gas Well Initial Productivity
In 2021, Green River new well Initial Productivity (IP) was over 6.2 MMcf/d has declined to around 4 MMcf/d in 2023. It fluctuates around 2.4 MMcf/d through 2040.
Green River Gas EUR
Well Estimated Ultimate Recovery (EUR) reached about 3.9 Bcf in 2022 and has dropped to 2.8 Bcf in 2023. EUR is expected to continue to drop to 1.7 Bcf in 2030.
Green River Well Count
Approximately 4,800 wells have been drilled since 2010. The number of new wells in Green River dropped significantly from 780 in 2010 to just 60 in 2023. Incorrys is forecasting the number of new wells to remain below 30 through 2030 and then increase to almost 230 by 2040. Over the 2020-2023 time period, the average lateral length was 1,750 ft with a average total depth of 11,000 ft.
Green River Map
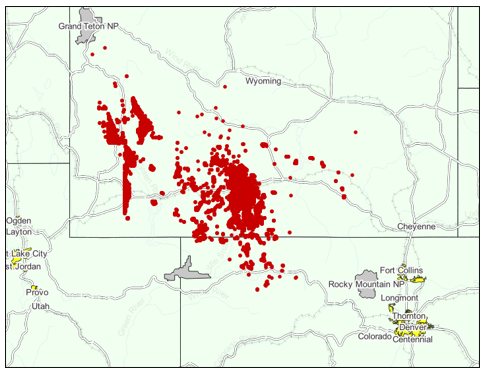
Green River gas wells 1990-2023.
Green River is primarily located in Wyoming extending into northern Colorado. Green River producing formations include Lance, Mesaverde Group, and others. Incorrys analysis is based on historical data obtained from individual US states.
See Also:
US Natural Gas Rig Count by Basin 2012-2024
US Natural Gas Rig Count by Trajectory 2012-2024
Initial Productivity (IP) for Major US Gas Basins 2023
Estimated Ultimate Recovery (EUR) for Major US Gas Basins 2023
Well Depth of Major US Gas Basins 2023
US Dry Natural Gas Production Forecast to 2040