November 17, 2025
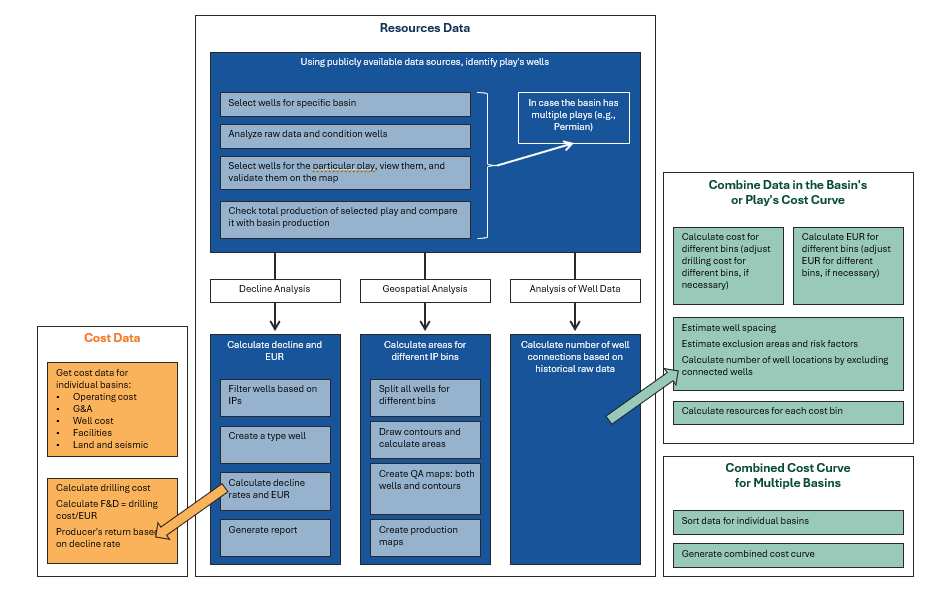
The figure illustrates Incorrys methodology behind the cost curve calculation for both crude oil and natural gas.

Incorrys maintains proprietary production models for key oil and gas plays in North America. These models analyze production histories and forecast annual average production for each play or basin based on:
- Regional drilling and completion activity. This depends on new well supply costs relative to costs in other plays, expected oil prices, natural gas liquids content, play maturity (well density and resource potential), and availability of equipment.
- New oil well initial productivity (IP), projected from recent trends, considering play maturity and the potential for incremental technology improvements.
- Production decline rates. Decline rates are applied to new and existing wells considering the age of wells.
- The models generate an oil production forecast. The associated gas production is estimated based on the historical and forecasted gas-oil ratio. Total production is sensitive to even small changes in these parameters, decline rates in particular. Production of each individual basin is forecast based on cost curves: basins with lower full-cycle cost will be developed first.
Main Assumptions
Incorrys estimated F&D cost, Operational cost, and Cost and Capital based on analysis of 275 projects from investor presentations and other public material presented by producers. Many producers, especially private companies do not report cost data. However, Incorrys believes that data collected represents full cycle costs accurately. Incorrys generates production maps and calculates areas based on well data (well coordinates and productivity obtained from public databases).
See Also:
Crude Oil Full Cycle Cost Components
North American Oil Resource Cost Curve
Full Cycle Cost of North American Oil by Basin

