

May 1, 2024
US GHG Emissions from Natural Gas Systems 1990-2030
Methane (CH4) is the main source of GHG emissions in US natural gas systems accounting for over 80% of the total. US methane emissions have decreased 14% since 1990, dropping from 215 Mt CO2eq to 185 Mt CO2eq in 2022. The decrease is attributable to drops from distribution, transmission, and storage. The decrease in distribution emissions is due to reductions from pipelines and distribution station leaks. Decreases in transmission and storage is largely due to reduced compressor station emissions (including emissions from compressors and equipment leaks). Despite a drop in emission intensity, total US GHG emissions from Natural Gas System are expected to grow moderately over the forecast period at about 3% annually reflecting continued growth of natural gas production.
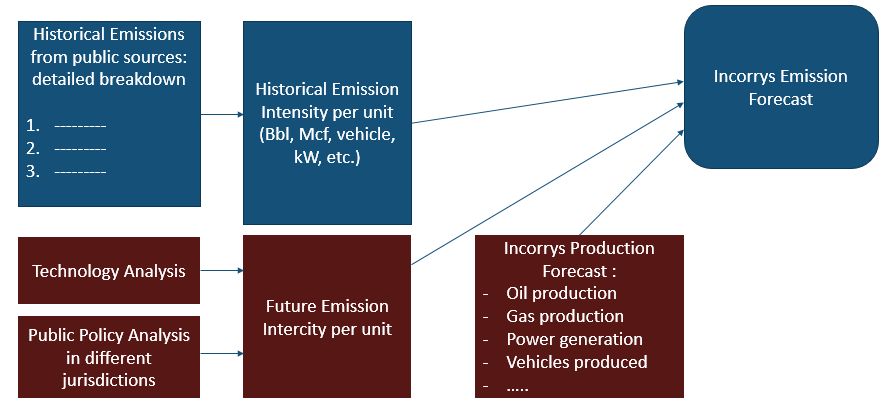
Incorrys Methodology to Forecast Emissions
See also:
US Historical GHG Emissions by Type 1990-2022
US Historical CO2 Emissions by Sector 1990-2022
US GHG Emission Intensity for Natural Gas Systems 2017-2030
Forecast of Emissions from US Petroleum Systems 1990-2030
Forecast of Emissions from US Petroleum Systems by GHG 2005-2030
Forecast of US Emissions from Natural Gas Flaring 2005-2030
References:
EPA. 2023. Inventory of U.S. Greenhouse Gas Emissions and Sinks: 1990-2021. U.S. Environmental Protection Agency, EPA 430-R-23-002. Available at https://www.epa.gov/ghgemissions/inventory-us-greenhouse-gas-emissions-and-sinks-1990-2021
https://www.epa.gov/system/files/documents/2023-04/US-GHG-Inventory-2023-Main-Text.pdf
IEA. December, 9, 2022. U.S. dry natural gas production set monthly records in 2022; we forecast an annual record. Available at https://www.eia.gov/todayinenergy/detail.php?id=54959.
IEA. 2023. Gas Market Report, Q2-2023. Available at https://iea.blob.core.windows.net/assets/6f2f0dcc-72af-4c01-bcc7-fbfe690ab521/GasMarketReportQ22023.pdf.
IEA. February, 21, 2023. Methane Tracker. Available at https://www.iea.org/data-and-statistics/data-tools/methane-tracker-data-explorer.