Crude Oil Full-Cycle Cost Components

November 13, 2024
Full-cycle cost components for crude oil includes; operating costs, royalties and production taxes, overhead, finding and development (F&D), producer return, and basis differential.
Finding & Development (F&D) and Operating Costs account for almost 50% of the crude oil full cycle costs while Royalties & Production Taxes and Producer Returns account for just over 40%.
Incorrys Cost Analysis Methodology
November 13, 2024
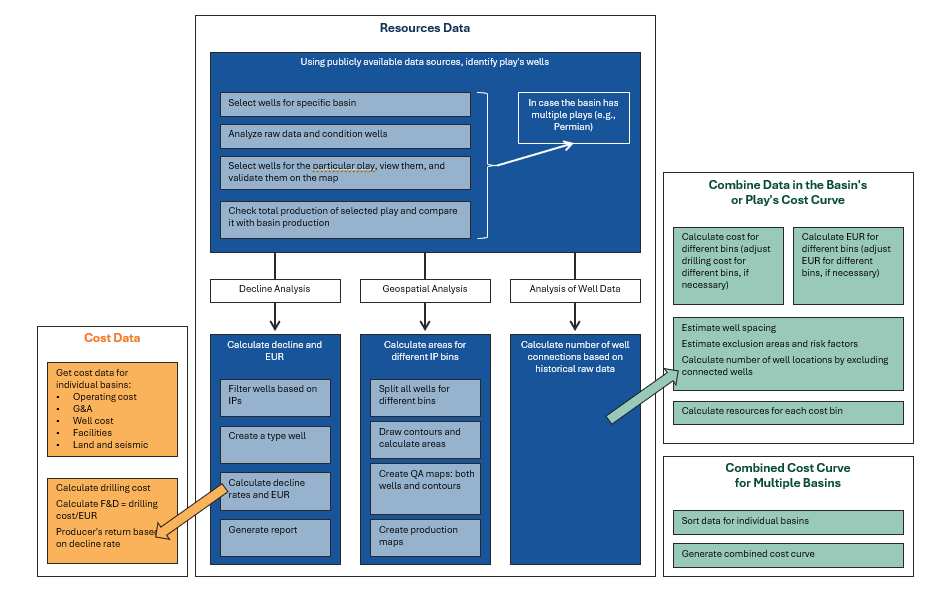
Incorrys maintains proprietary production models for key oil and gas plays in North America.
Incorrys estimated F&D cost, Operational cost, and Cost and Capital based on analysis of 275 projects from investor presentations and other public material presented by producers. Many producers, especially private companies do not report cost data. However, Incorrys believes that data collected represents full cycle costs accurately.
North American Oil Resource Cost Curve
November 14, 2024
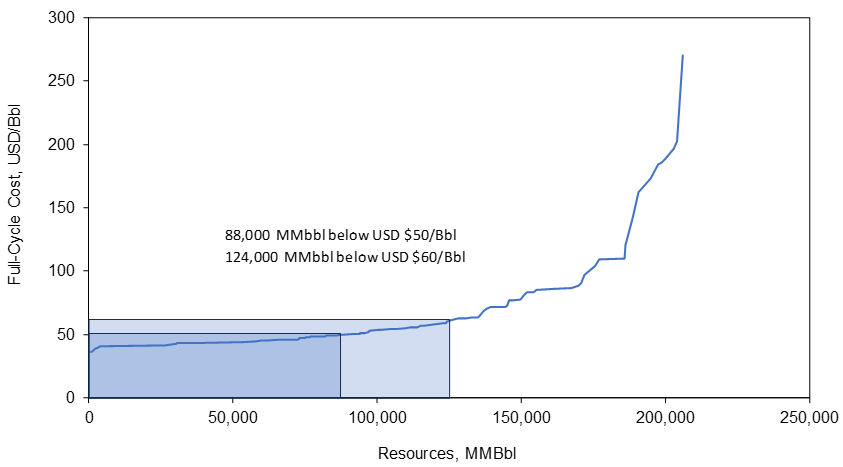
North American Oil and Lease Condensate full cycle cost vs. resources for all major producing basins in US (Permian, Williston, Niobrara, Eagle Ford, Anadarko and Unita), as well as Canadian plays – exclusive of Oil Sands.
The resource cost curve shows North America has 88,000 MMBbl of oil and condensate potential with full cycle cost less than USD$50/Bbl and 124,000 MMBbl with full cycle cost at or below USD$60/Bbl.
Full Cycle Cost of North American Oil by Basin

November 14, 2024
Full cycle costs of North American oil and lease condensate over the period Q1 2022 through Q3 2024 for all major producing basins in the US and Canada (including oil sands).
The full-cycle cost for the highest productivity Tight Oil wells is slightly below USD $40/Bbl, and remaining resources associated with this cost level is 2,000 MMBbl (Permian).
North American Oil Full Cycle Cost Breakdown by Basin

November 14, 2024
Full cycle costs of North American oil and lease condensate by component for all major producing basins in the US and Canada.
The chart includes all major producing basins in the US (Permian, Williston, Niobrara, Eagle Ford, Anadarko and Unita) and Canada (excluding Oil Sands). California is included for comparison.
Well Costs by Play/Basin
November 15, 2024
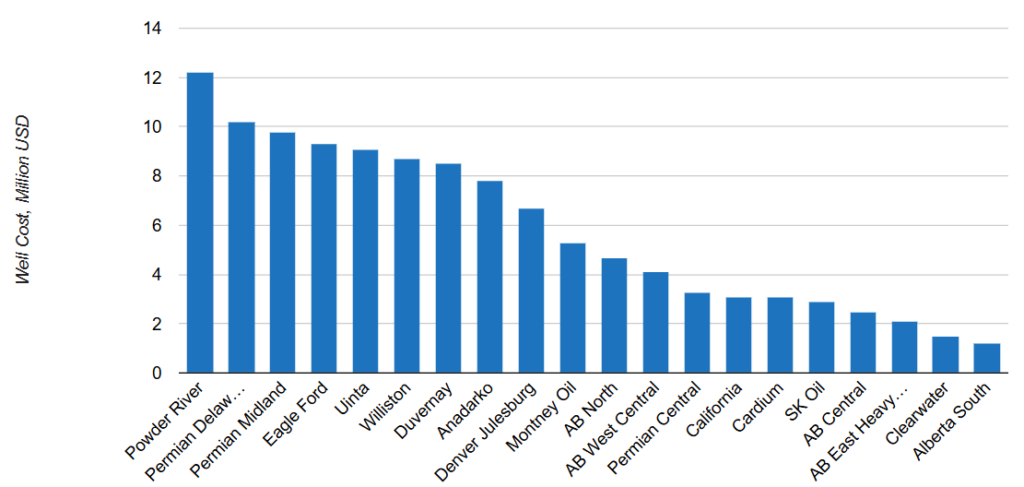
Cost per Well (in Million$ USD) across different oil basins and plays, in both the US and Canada, over the period Q1 2022 thought Q3 2024. The well cost includes drilling and completion (fracking, casing, cementing, etc.) costs, but does not include cost of land and tie in costs.
Powder River has the highest cost per well, exceeding USD $12M/well while Alberta Central and Alberta South show the lowest costs, around USD $2M/well and lower.
Capital Cost of Power Generation by Source
August 8, 2024
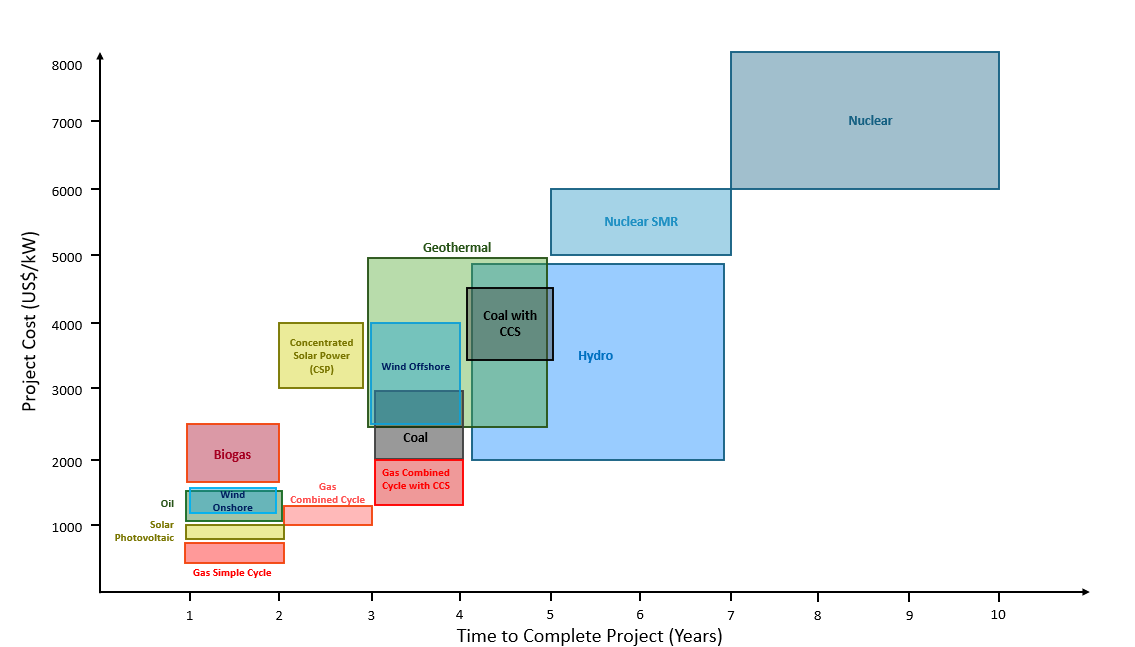
The range of capital cost of power generation (USD/kW of capacity) by source including natural gas, biogas, coal, wind, solar, hydro and nuclear vs time to complete each type of project.
Natural gas simple cycle plants have the lowest cost ($700-$900/kW) and one of the shortest timelines to complete (1-2 years). Solar photovoltaic systems ($800-$1,000/kW) and onshore wind projects ($1,200-$1,500/kW) are also among the lower-cost options while traditional nuclear power plants ($6,000-$8,000 per kW) are among the most expensive to build and can take 7-10 years to build.
Cost of Russian Oil
December 16, 2022
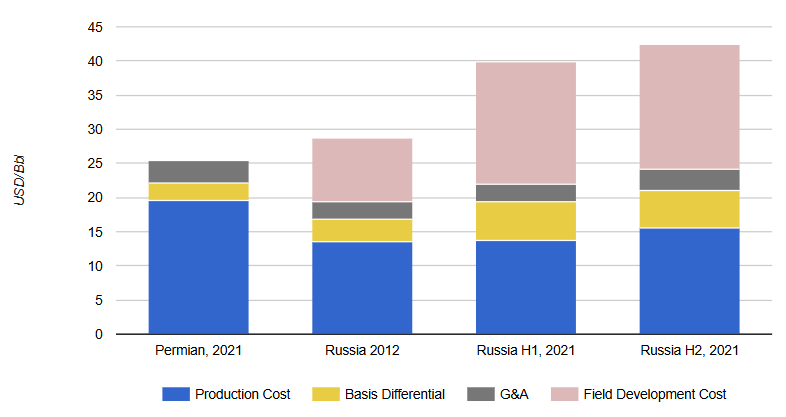
The cost of Russian oil in USD/Bbl for 2012, H1, 2021, and H2, 2021. Since Russia’s costs are not on a ‘full cycle’ cost basis like North America, Incorrys calculated an equivalent 2021 cost of the US Permian Basin for comparison.
The total cost of Russian oil reaches USD $40-45/Bbl in 2021 including the cost for development of new fields however, as most new fields are located in remote areas of Siberia, they require significant infrastructure investment. The total cost of oil in Russia without new field development is comparable to costs in the Permian and other US Tight Oil basins.
Full-Cycle Costs of Tight and Conventional Oil
September 1, 2021
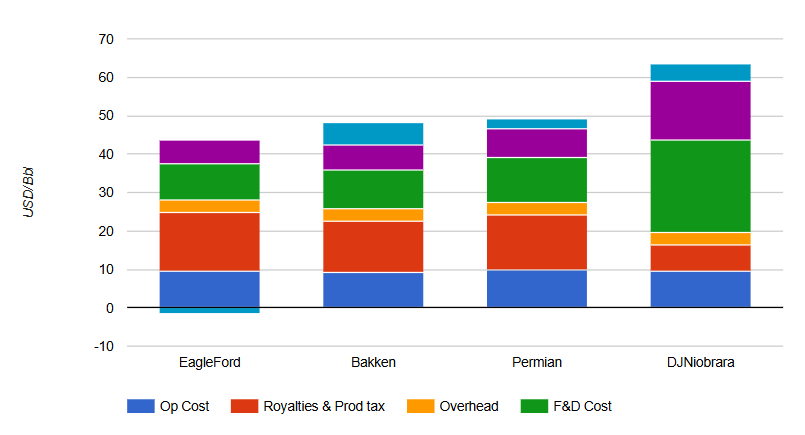
Detailed full-cycle costs for four oil plays by cost component (operating costs, royalties and production taxes, overhead, Finding and Development (F&D), producer return, and basis differential). Additional chart of the total full-cycle cost ranked by play.
Since 2018, most oil wells drilled in US are horizontal wells with multi-stage fracking drilled in tight oil basins, only a very limited number of wells are being drilled in the conventional basins.
Natural Gas Full-Cycle Cost Components
September 3, 2021
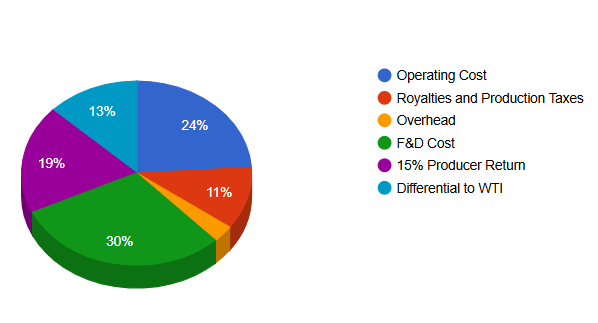
Full-cycle cost components for natural gas includes; operating costs, royalties and production taxes, overhead, finding and development (F&D), producer return, and basis differential.
F&D and operating costs account for over 50% of the natural gas full-cycle costs while royalties & production taxes producer returns account for a little less than a third.
North American Natural Gas Cost Curve
July 29, 2021
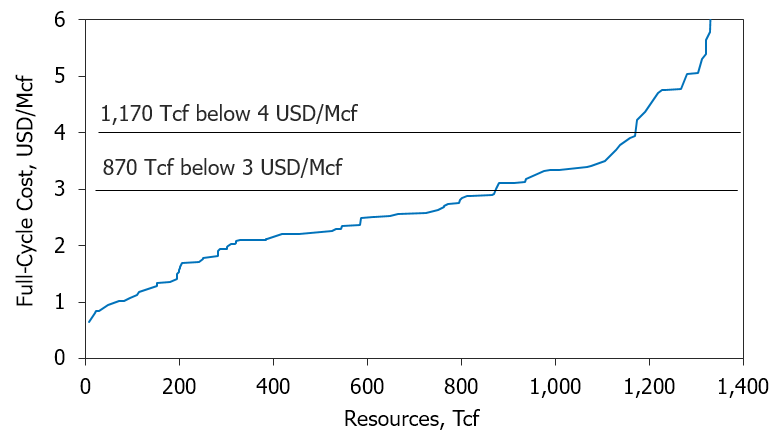
Full-cycle cost curve for North American natural gas at Henry Hub illustrates the amount of natural gas resource available at various cost levels.
There is about 30 years of North American natural gas supply available at USD4 per MMBtu based on 2021 North American natural gas demand.
Full-Cycle Cost by Basin at Henry Hub
July 29, 2021
Full-cycle cost by basin and cost component at Henry Hub. Additional chart of Net full-cycle cost taking into account liquids uplift revenue.
The lowest full-cycle costs are realized at Haynesville and the highest is Arcoma; the average full-cycle cost is just under 4 USD/Mcf.
Natural Gas Full-Cycle Cost Changes (2021$)
September 1, 2021
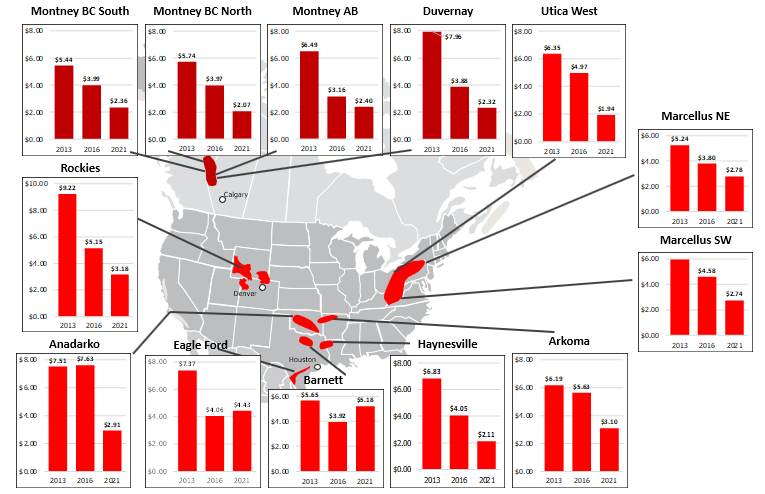
Natural gas full-cycle cost changes, by basin, comparing the years 2013, 2016, and 2021.
The drop in full cycle costs for most natural gas basins dropped in 2021 compared to the 2013 and 2016 is partially due to increased new well productivity and a focus on liquid rich areas.

