

May 1, 2024
Forecast of US Emissions from Natural Gas Flaring 2005-2030
Associated gas flaring emissions (CO2 and CH4) peaked in 2019 at over 25 Mt CO2eq primarily due to Williston Basin emissions. The impact of the Covid pandemic resulted in a significant decrease in 2020 DOWN to under 20 Mt CO2eq and they decreased further in 2021 to just over 10 Mt CO2eq. In 2022. Combined, Texas (47%) and North Dakota (38%) accounted for 85% of the total, or 1.3 Bcf/d of the reported US vented and flared natural gas. North Dakota incorporated several regulation norms in connection with emissions. Even with growth of oil production in Permian and Williston basins, GHG emissions from flaring are expected to drop to 9 Mt CO2eq in 2030. By 2030, total emissions from flaring will decline by almost 70% from their 2019 peak and by 40% since 2023. Incorrys prepared the forecast for natural gas flaring based on analysis of processing and pipeline infrastructure, associated gas supply forecasts and government regulations.
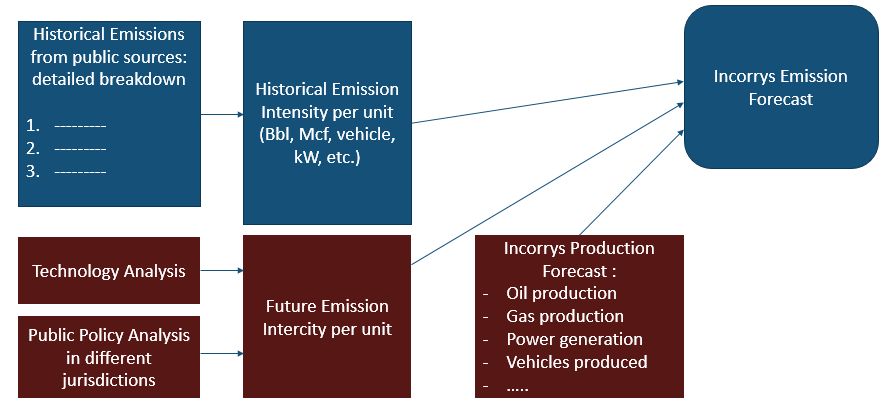
Incorrys Methodology to Forecast Emissions
See also:
US Historical GHG Emissions by Type 1990-2022
US Historical CO2 Emissions by Sector 1990-2022
US GHG Emission Intensity for Natural Gas Systems 2017-2030
US GHG Emissions from Natural Gas Systems 1990-2030
Forecast of Emissions from US Petroleum Systems 1990-2030
Forecast of Emissions from US Petroleum Systems by GHG 2005-2030
References:
EPA. 2023. Inventory of U.S. Greenhouse Gas Emissions and Sinks: 1990-2021. U.S. Environmental Protection Agency, EPA 430-R-23-002. Available at
https://www.epa.gov/ghgemissions/inventory-us-greenhouse-gas-emissions-and-sinks-1990-2021
https://www.epa.gov/system/files/documents/2023-04/US-GHG-Inventory-2023-Main-Text.pdf
Global Gas Flaring Tracker Report https://thedocs.worldbank.org/en/doc/5d5c5c8b0f451b472e858ceb97624a18-0400072023/original/2023-Global-Gas-Flaring-Tracker-Report.pdf
Legislative Branch. Chapter 43-02-03. Oil and Gas Conservation. Available at https://www.ndlegis.gov/information/acdata/pdf/43-02-03.pdf