

US GHG Emissions Intensity from Oil and Gas Industry
November 28, 2025
The oil and gas sector accounts for 0.32 billion metric tons, or about 5% of total emissions. This figure represents emissions directly from oil and gas production, transportation, and processing, and does not include emissions from burning oil and gas by other industries or consumers.
US GHG Emissions from Oil and Gas Industry
November 28, 2025
In 2023, the United States emitted nearly 6.2 billion metric tons of greenhouse gases (CO₂e). Most human-caused (anthropogenic) greenhouse gas (GHG) emissions—over 70%—come from burning fossil fuels. The oil and gas sector accounts for 0.32 billion metric tons, or about 5% of total emissions. This figure represents emissions directly from oil and gas production, transportation, and processing, and does not include emissions from burning oil and gas by other industries or consumers.
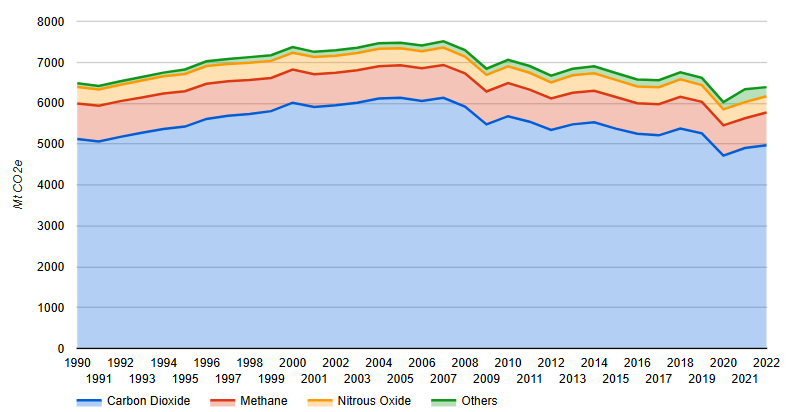
US Historical GHG Emissions by Type 1990-2022
May 1, 2024
Total historical US greenhouse gas (GHG) emissions for the period 1990-2022, by type of GHG; without Land Use, Land-Use Change, and Forestry (LULUCF) emissions and sinks. Total US GHG emissions grew between 1990 and 2007 and have since generally trended downward through 2022. By far, the largest contributor to total US GHG emissions is CO2.
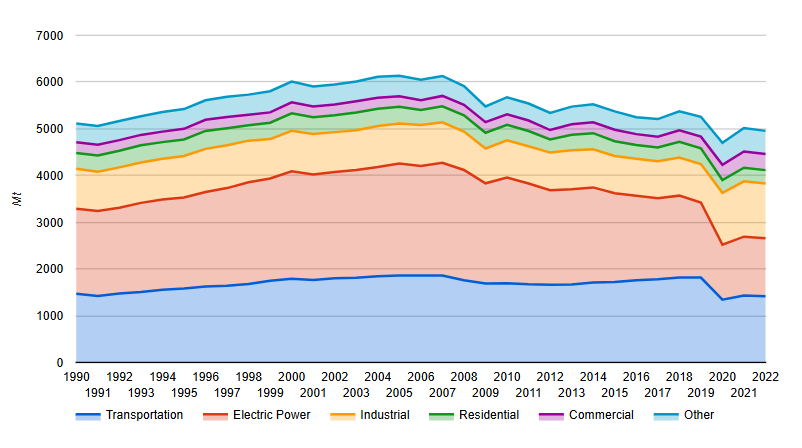
US Historical CO2 Emissions by Sector 1990-2022
May 1, 2024
Historical US carbon dioxide (CO2) emissions by demand sector (transportation, electric power, industrial, residential, commercial, and other) for 1990-2022. The electric power sector generated the most CO2 emissions in the US through 2016, accounting for about 37% of the total. Since then, as more coal generation is shuttered and renewables are brought online, it has dropped below the transportation sector and accounted for about 25% of total.
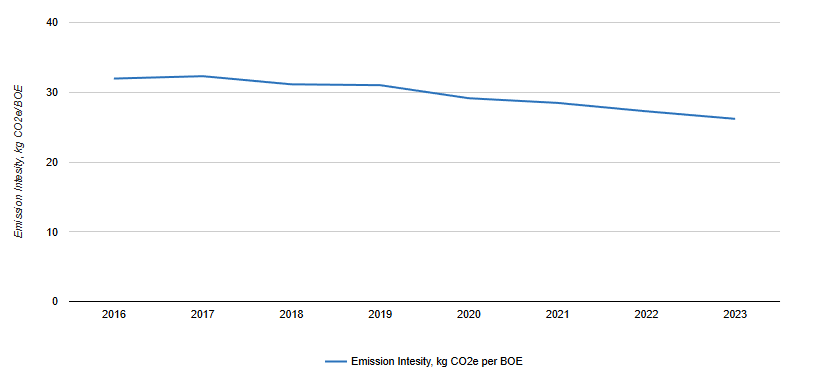
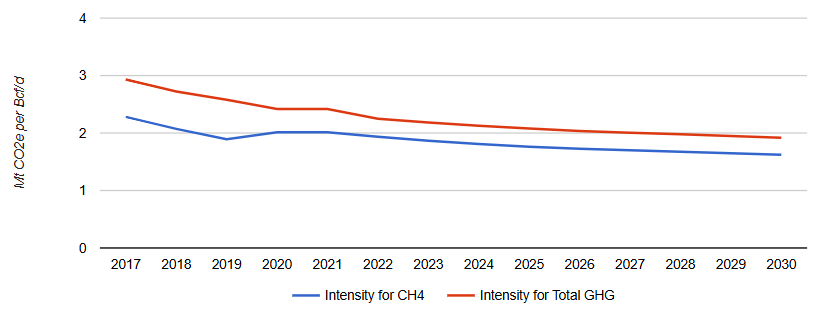
US GHG Emission Intensity for Natural Gas Systems 2017-2030
May 1, 2024
US greenhouse gas (GHG) emissions intensity for natural gas systems to 2030 calculated as total emissions from natural gas systems divided by historical and future dry gas productions. Additional chart illustrating Incorrys emissions forecast methodology. Emissions intensity is forecast to decline as the result of various measures mainly focused on methane (CH4) emission reductions, the largest compound of natural gas.
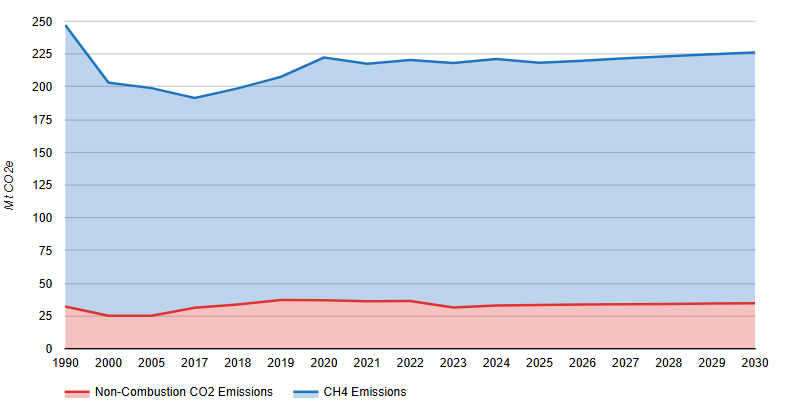
US GHG Emissions from Natural Gas Systems 1990-2030
May 1, 2024
US greenhouse gas (GHG) emissions from natural gas systems, from 1990-2030, showing emissions from methane (CH4) and non-combustion carbon dioxide (CO2). Additional chart illustrating Incorrys emissions forecast methodology. Methane (CH4) is the main source of GHG emissions in US natural gas systems accounting for over 80% of the total. Despite a drop in emission intensity, total US GHG emissions from Natural Gas System are expected to grow moderately reflecting continued growth of natural gas production.
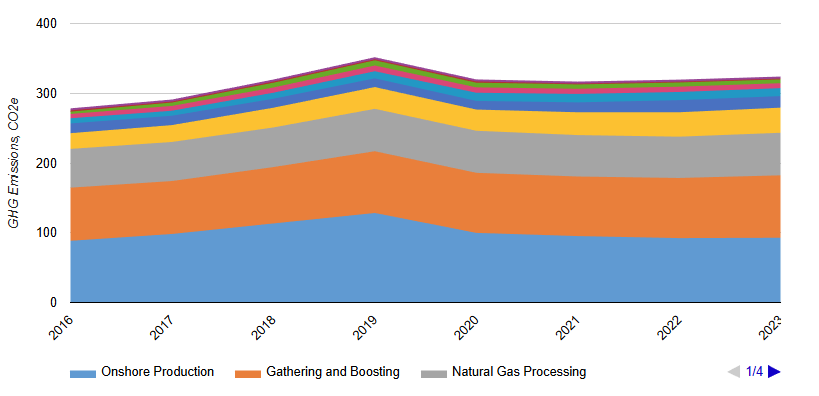
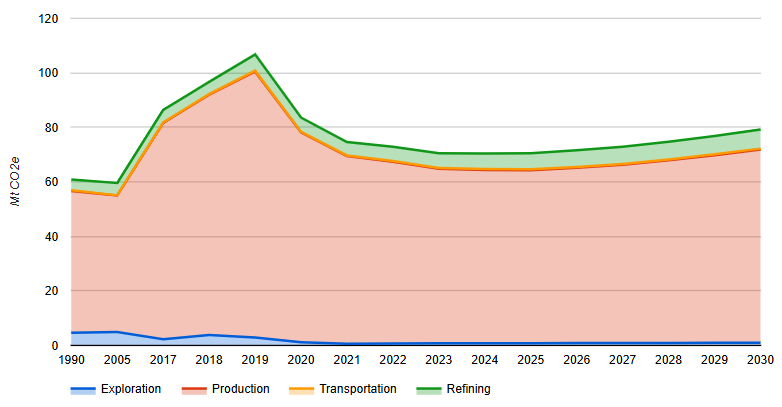
Forecast of Emissions from US Petroleum Systems 1990-2030
May 1, 2024
Greenhouse gas (GHG) emissions forecast from US petroleum systems to 2030, by sector (exploration, production, transportation, and refining of oil). Emissions peaked in 2019 at over 100 Mt CO2eq before declining 85 Mt CO2eq in 2020, primarily due to the impact of the Covid pandemic. They have continued downward in 2021 and 2022, albeit a relatively slow rate. Production emissions account for about 80% of the total CO2 emissions.
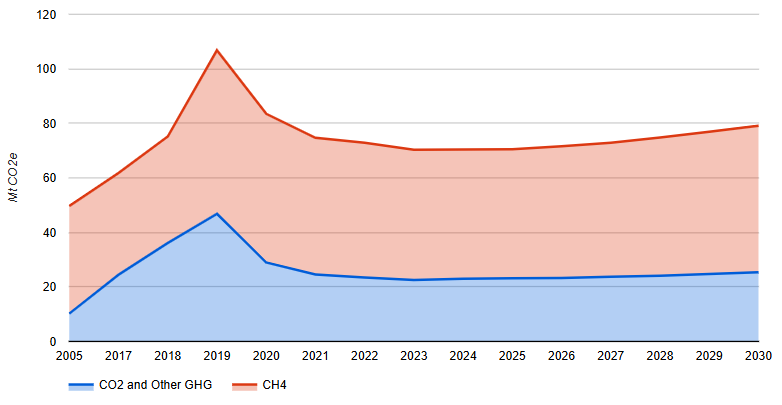
Forecast of Emissions from US Petroleum Systems by GHG 2005-2030
May 1, 2024
Forecast to 2030 of greenhouse gas (GHG) emissions from US petroleum systems by type of GHG. GHG emissions, by greenhouse gas, from US petroleum systems is led by CO2 and CH4. Emissions of other gases is negligible.
Forecast of US Emissions from Natural Gas Flaring 2005-2030
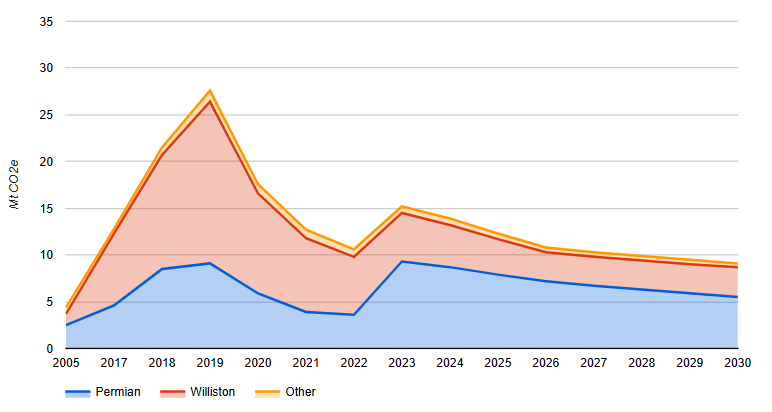
May 1, 2024
US carbon dioxide (CO2) and methane (CH4) emissions from associated natural gas flaring forecast to 2030. Associated gas flaring emissions (CO2 and CH4) peaked in 2019 at over 25 Mt CO2eq primarily due to Williston Basin emissions. Incorrys prepared the forecast for natural gas flaring based on analysis of processing and pipeline infrastructure, associated gas supply forecasts and government regulations.