

May 1, 2024
Natural gas emission intensity is calculated as emissions from natural gas systems divided by dry gas productions. Total US greenhouse gas emissions (CH4, CO2, and N2O) from natural gas systems in 2021 were 220 Mt, a decrease of 12% from 1990 and a of 2% drop from 20 CO2eq, both primarily due to decreases in CH4 emissions (from 215 Mt CO2eq in 1990 to 180 Mt CO2eq in 2021. US dry gas production increased by an about 4% from October 2022 to March 2023, reaching an average daily level of 100 bcf in the first quarter of 2023. This resulted In GHG emissions intensity to drop to 2,25 Mt CO2eq per Bcf/d in 2022 with CH4 dropping to 1.93 Mt CO2eq per Bcf/d. Incorrys is projecting US natural gas production to expand over 20% by 2030 to about 120 Bcf/d versus 98 Bcf/d in 2022, due to expected growth of LNG exports, power generation, industrial demand and pipeline exports to Mexico. Emission intensity is expected to continue to decline due to various measures primarily focused on CH4 emission reduction.
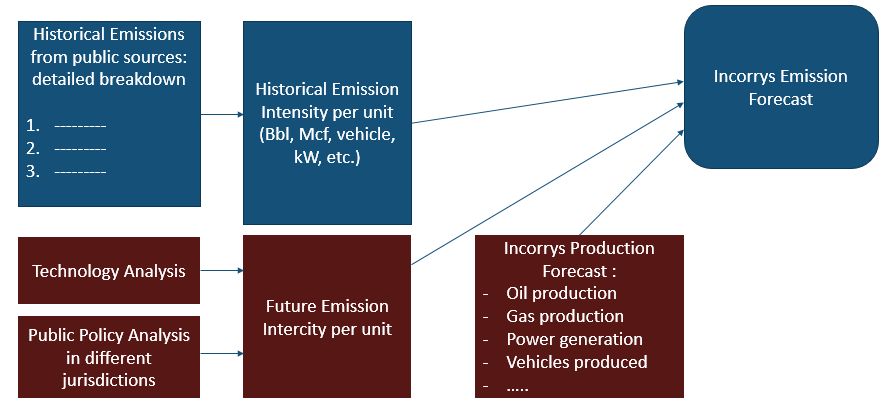
Incorrys Methodology to Forecast Emissions
See also:
US Historical GHG Emissions by Type 1990-2022
US Historical CO2 Emissions by Sector 1990-2022
US GHG Emissions from Natural Gas Systems 1990-2030
Forecast of Emissions from US Petroleum Systems 1990-2030
Forecast of Emissions from US Petroleum Systems by GHG 2005-2030
Forecast of US Emissions from Natural Gas Flaring 2005-2030
References:
EPA. 2023. Inventory of U.S. Greenhouse Gas Emissions and Sinks: 1990-2021. U.S. Environmental Protection Agency, EPA 430-R-23-002. Available at
https://www.epa.gov/ghgemissions/inventory-us-greenhouse-gas-emissions-and-sinks-1990-2021
https://www.epa.gov/system/files/documents/2023-04/US-GHG-Inventory-2023-Main-Text.pdf
IEA. December, 9, 2022. U.S. dry natural gas production set monthly records in 2022; we forecast an annual record. Available at https://www.eia.gov/todayinenergy/detail.php?id=54959.
IEA. 2023. Gas Market Report, Q2-2023. Available at https://iea.blob.core.windows.net/assets/6f2f0dcc-72af-4c01-bcc7-fbfe690ab521/GasMarketReportQ22023.pdf.
IEA. February, 21, 2023. Methane Tracker. Available at https://www.iea.org/data-and-statistics/data-tools/methane-tracker-data-explorer.