

November 13, 2025
Worldwide liquefied natural gas (LNG) liquefaction facilities (operating and under construction) in MTPA coupled with shipping routes and flows (MT) to various import countries.
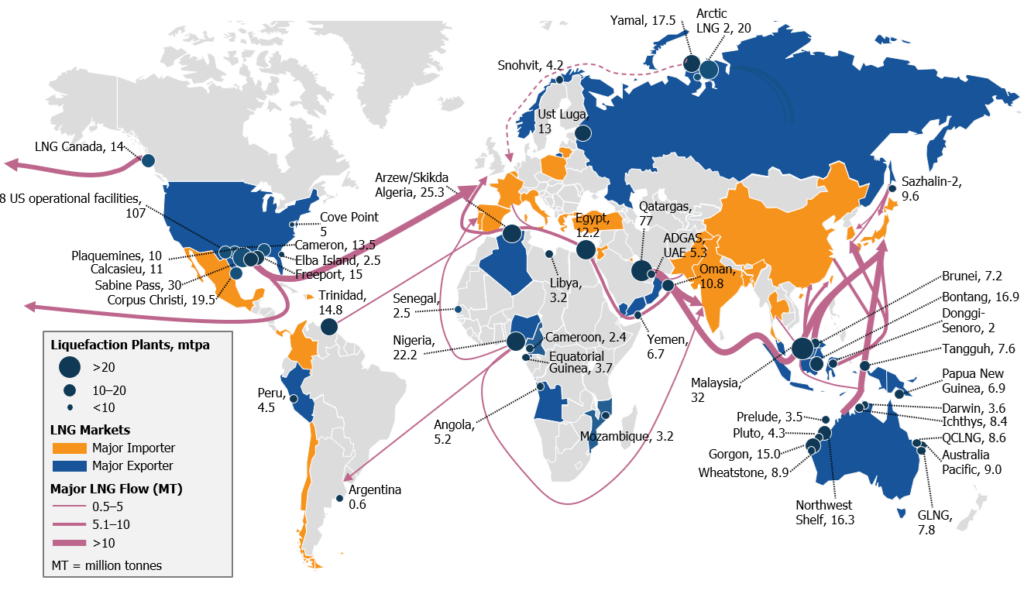
Approximate locations (as of Nov 2025); includes operational and under construction projects with start dates before 2026. Not all facilities are operating at capacity due to declining gas feedstock production, operational issues, and other factors. Global LNG trade reached just over 411 mtpa in 2024, connecting 22 exporting countries with 48 importing markets. The increase can be attributed primarily to restricted pipeline flows from Russia following their invasion of the Ukraine. Increased European demand pushed LNG prices higher to attract cargoes from Asia. European and East Asian markets are sourcing LNG primarily from the Middle East, Indonesia, Malaysia, Australia, and increasingly from the US.
See Also:
LNG Shipping Distances To Asia (Approximate)
LNG Shipping Fleet and Charter Rates