

June 14, 2023
Solar Power Generation
The cumulative global solar generation increased from just 32 TWh in 2010 to 1250 TWh in 2022. Solar generation has grown over 20% annually since 2020 increasing from 180 TWh to 245 TWh.
Solar Power Generation Market Share 2022
In 2022, of the 1250 TWh of global solar generation, China accounted for 34% (almost 420 TWh) while the US represented about 17% (about 220 TWh). Rounding out the top 5 are: Japan (7% / 90 TWh), India (6% / 75 TWh) and Germany (5% / 60 TWh). The rest of the world combined accounted for 31% (380 TWh).
Generation by Country
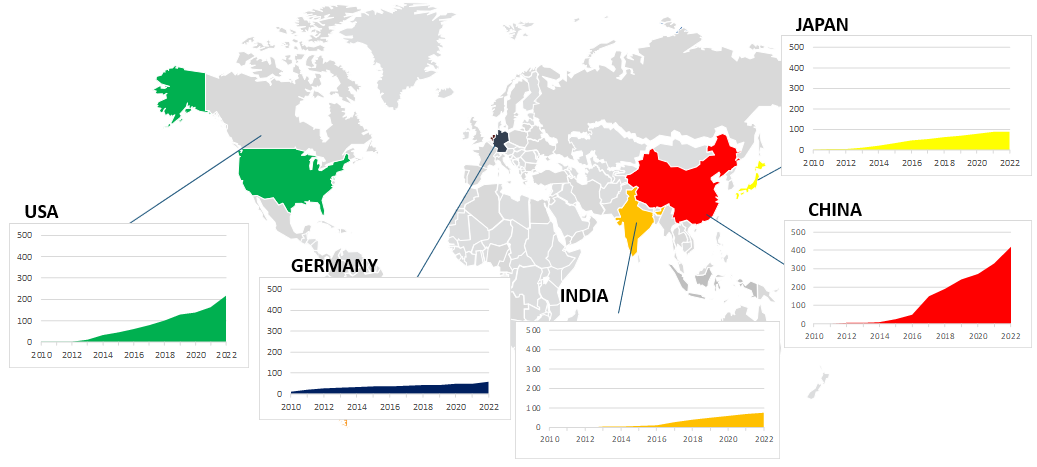 Like capacity, all major regions have shown significant year-over-year generation growth rates, with the exception of Germany.
References:
Our World in Data based on BP Statistical Review of World Energy; Ember, N\A. https://ourworldindata.org/grapher/solar-energy-consumption
World Economic Forum (2023, April, 14), How much did wind and solar contribute to global electricity in 2022? https://www.weforum.org/agenda/2023/04/how-much-did-wind-and-solar-contribute-to-global-electricity-in-2022/
Wikipedia, N\A, Growth of photovoltaics. https://en.wikipedia.org/wiki/Growth_of_photovoltaics
Maguire G. (2023, March, 1). Column: China widens renewable energy supply lead with wind power push. https://www.reuters.com/markets/commodities/china-widens-renewable-energy-supply-lead-with-wind-power-push-2023-03-01/
IEA (2022, September), Solar PV. https://www.iea.org/reports/solar-pv